Where Did the Data Go?!?
In many scenarios, a dashboard displays a cascade of filter options to guide the user to a subset of data in the view. One issue with this method is when a user selects a final filter option (the child) and then selects something different from the previous option (the parent), the chart in the view blanks out. The lack of valid data occurs when the final child filter option does not correspond with the previous parent filter selections. To correct the view and see data, the user must remove the filter selection from the child filter and start again. Users may not immediately know what to do next when a chart goes blank; if they are aware of this, they will likely find this action tedious. A way to improve the user experience is to show an error message of what is occurring.
In this post, I’ll share a simple trick for hiding and revealing a message corresponding to the filters when the parent and child selections do not match correctly. This straightforward solution can alleviate users’ frustration when the chart blanks out.
The Frustration of Conflicting Filters
To illustrate this solution, let’s consider a real-world example from our work with the JSI and HRSA team on the Workforce Well-being Survey. In this dashboard, we initially present the user with a parameter to choose whether they want to filter the data by a survey respondent’s demographic characteristic or job category. Once a selection is made, a parameter and filter option become available (a parent parameter of a high-level grouping of these options and a child filter of options within that group), allowing for a more detailed data analysis within the chosen group.
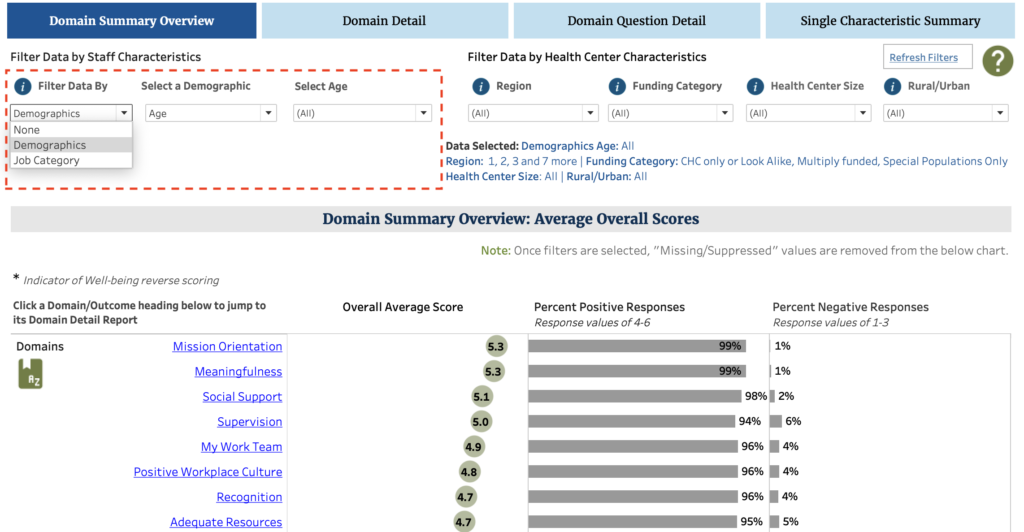
Let’s describe the issue that occurs with an example. A user first chooses to view the data by ‘Demographics.’ They choose ‘Age’ in the parent parameter and ’40 and Older’ in the child filter. Great! They see the expected data. Imagine that the user is now interested in changing the view to see results by gender instead of age. They return to the parent parameter and select ‘Gender’ and are met with a blank screen, to their surprise. The view no longer has any valid data to display since the child filter is still set to ’40 and Older,’ an option not available in the parent parameter ‘Gender.’
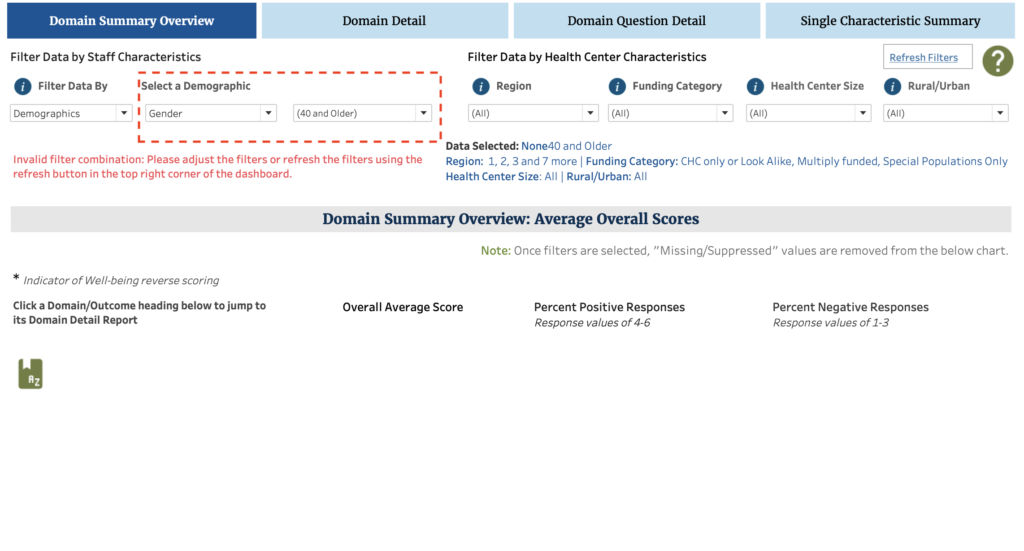
To fix this issue and reveal data again, the user must set the child filter back to ‘All’ and then re-select the desired option of ‘Gender’ in the parent parameter. These steps are not usually apparent or easily understood by the average dashboard user.
Here is when an error message can help describe what has occurred and assist with what to do next. The message will only reveal itself when the parent and child filters are mismatched. The following steps will review how to achieve this.
How to Create a Dynamic Error Message in Tableau
As mentioned, the objective is to create an error message that appears when filter selections conflict so users are immediately notified that the blank screen is not a glitch and they didn’t break the dashboard by clearly explaining to the steps needed to bring data into the view.
Here are the simple steps to create this dynamic error message:
Step 1: Create a Message in the Dashboard
- Place a Text Object onto your dashboard and type the error message in a color that will draw immediate attention from the user, such as a bright red. An example error message is: “Invalid filter combination. Please adjust the filters by resetting it to ‘All’ and then make a new selection.’
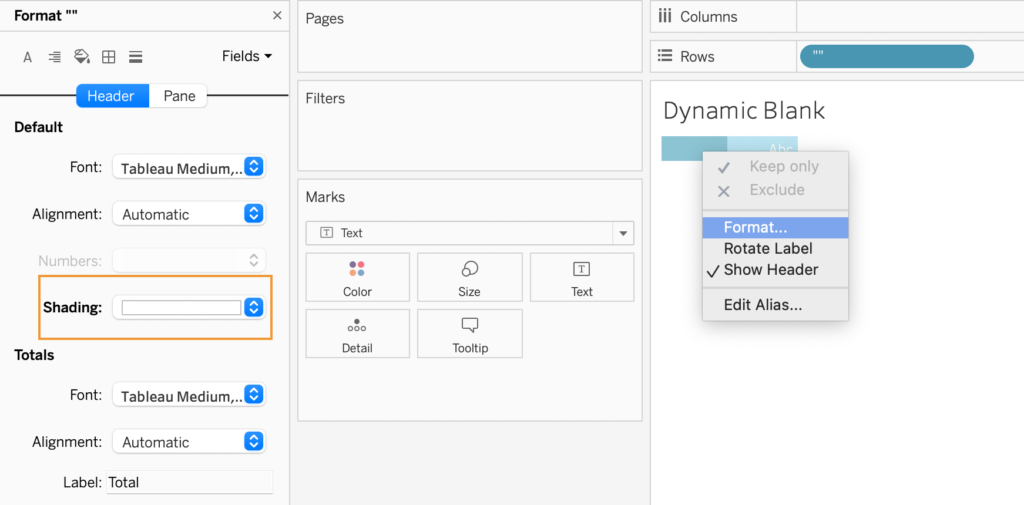
Step 2: Create a Blank Worksheet to Hide/Reveal the Error Message
- Open a new worksheet. Rename it ‘Dynamic Blank.’
- Double-click onto the rows shelf and type two quotation marks. This creates a blank header.
- Make the Header the color white by right-clicking on the space of the blank header. Then select ‘Format’.
- Under ‘Shading’ click the drop-down arrow and select white.
Step 3: Apply the Filter to the Dynamic Blank Worksheet
- Go back to the dashboard and click the child filter to select it.
- Click the drop-down caret, select ‘Apply to Worksheets’ > ‘Selected Worksheets’ > and select the ‘Dynamic Blank’ worksheet.
Step 4: Add the Dynamic Blank Worksheet to the Dashboard and Format
- At the bottom of the Dashboard pane, select ‘Floating.’
- Click and drag the ‘Dynamic Blank’ onto the dashboard directly on top where you’ve placed your error message. Make sure it covers all the text.
- Hide the title.
- Change the Fit to ‘Entire View’.
- Hover your cursor between the Header and the Pane to view the bi-directional arrow. Drag it to the right, ensuring all the text in the error message below is obscured by the floating worksheet.
Test out the Dynamic Blank worksheet by selecting an option from the parent parameter that does not correspond to the child filter. The Dynamic Blank worksheet should go blank, as in see-through, to reveal the underlying error message.
Want More?
What more tips and tricks about dynamic filtering and creating a better user experience? Then check out the prior post about using Dynamic Zone Visibility to Enhance Filter Options in Tableau.
Be sure to check out the next related blog post, where we review how to create a refresh button to make fixing the parent and child filter issue easier to navigate.