Tableau is an incredibly versatile tool for creating data visualizations that can bring your insights to life. However, how you format these visuals can affect how easily your audience understands and interacts with your data. Whether you’re just beginning your Tableau journey or a seasoned pro, mastering formatting is key to taking your projects to the next level.
In this blog post, I’ll share six time-saving Tableau tips to simplify the formatting process. From maintaining consistent fonts and colors to aligning your charts perfectly for maximum impact, these tips will help you save time and create dashboards that are as polished as they are informative. Let’s get started!
Tip 1: Copy and Paste Worksheet Formatting
Any Tableau developer knows that getting the formatting right can be tedious and time-consuming. But what if you could apply the same sleek design to multiple worksheets with just a few clicks? You can—thanks to Tableau’s helpful Copy and Paste Formatting feature. Just follow these simple steps to save valuable time and keep your visualizations looking sharp by efficiently transferring formatting from one worksheet to another.
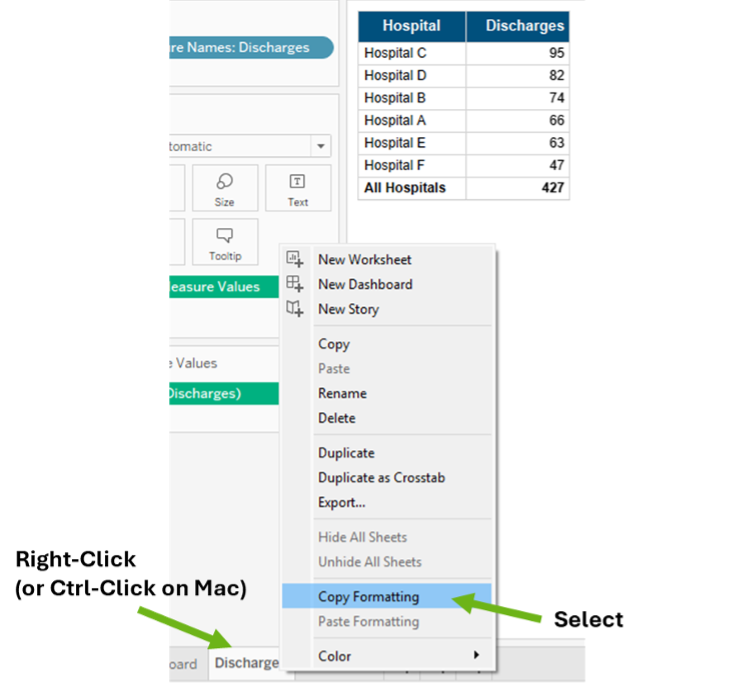
Step 1: Copy Formatting – Select the worksheet with your desired formatting. Right-click (or control-click on Mac) the worksheet tab and select Copy Formatting.
Step 2: Paste Formatting – Go to the target worksheet, right-click (or control-click) the tab, and select Paste Formatting.
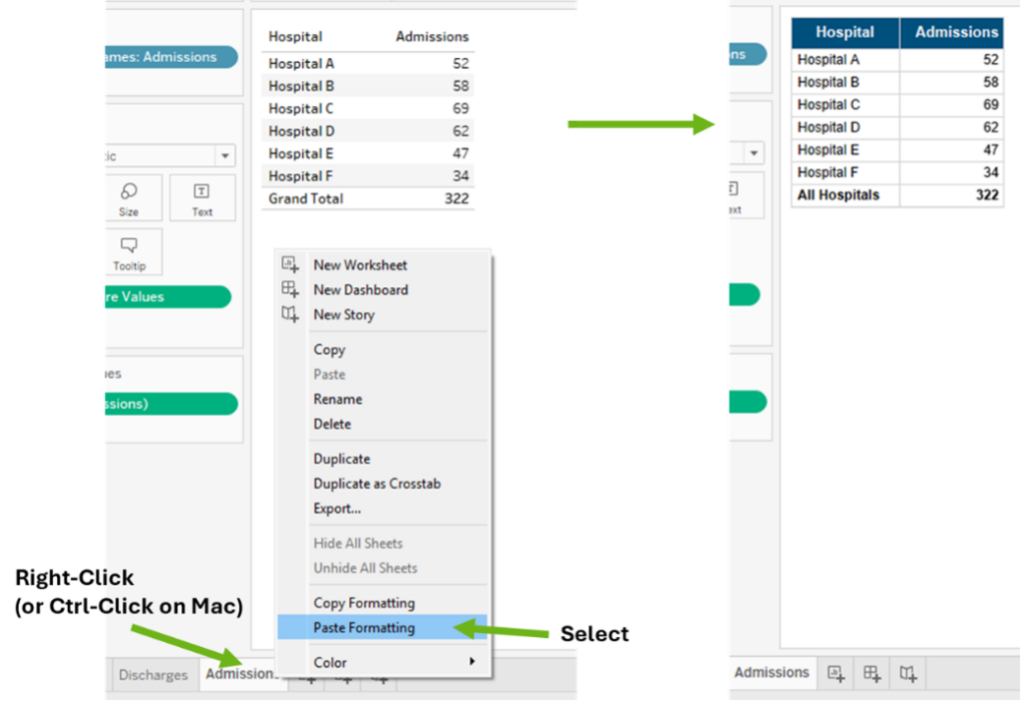
It’s important to note that reference lines and annotations won’t transfer over, and any manual size adjustments or zoom levels will need to be redone. However, you’ll be able to copy the bulk of your formatting—like fonts, borders, background colors, and even text alignment.
Tip 2: Preserve Formatting when Swapping Fields
Swapping one field for another in Tableau is a breeze—simply drag and drop the new field onto the old one in the rows/columns shelf. However, while this action is fast and straightforward, it resets all your formatting to the workbook’s default settings; therefore, any custom formatting or sorting you’ve applied will be lost.
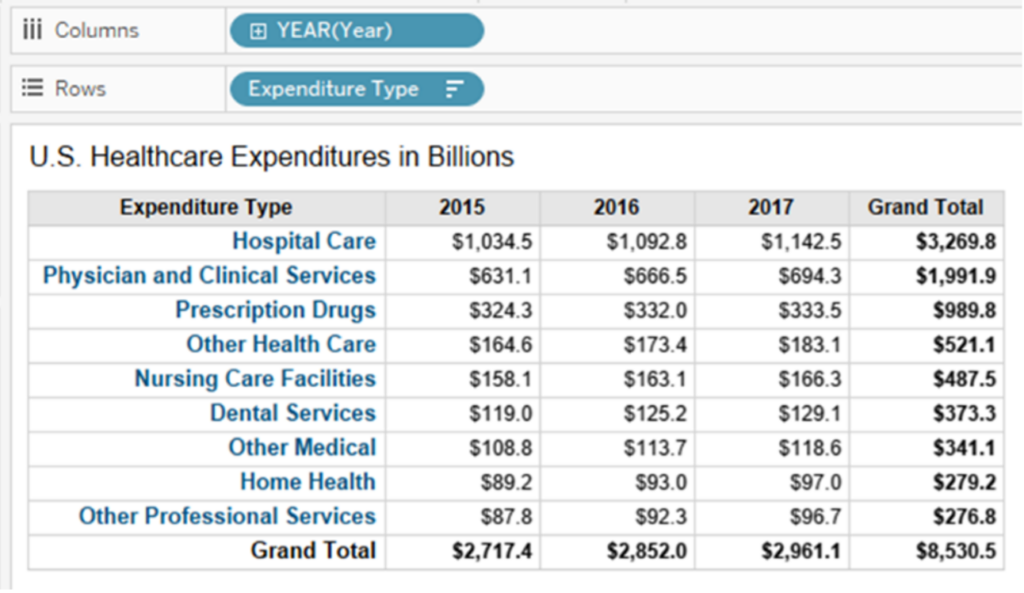
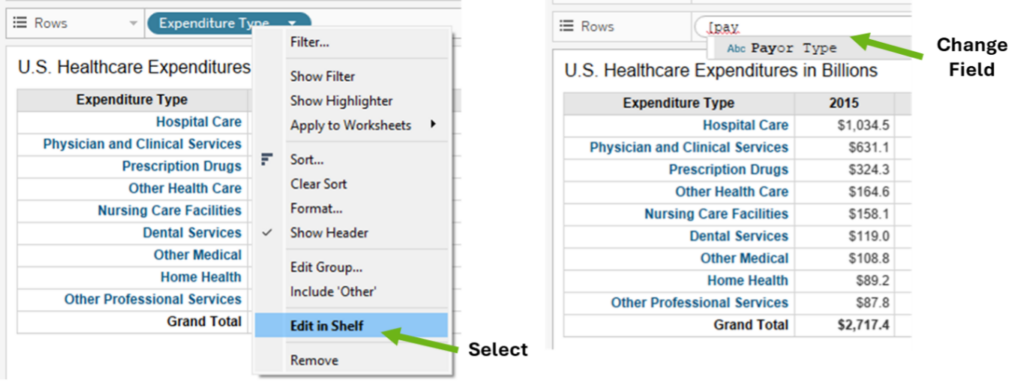
In the following example, I would like to swap out the dimension Expenditure Type on the Rows shelf for another dimension, Payor, to change the analysis on healthcare expenditures in the view. To highlight this change, I’ve colored the header blue, increased the font size, aligned the text to the right, and sorted the values in descending order.
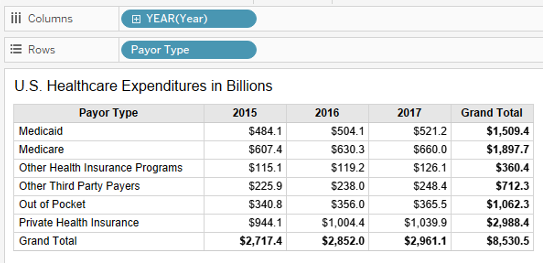
However, after I dragged and dropped the replacement field onto the Rows shelf, the font color, size, and alignment were reset, and the values were no longer sorted in descending order as intended.
One effective way to avoid losing your formatting is to edit fields directly on the Rows/Columns shelf. To do this, right-click on the pill you want to replace, choose “Edit in Shelf,” or double-click on the pill to open the in-line editing feature and start typing the name of the field you wish to swap in. This method ensures that your formatting remains unchanged, making the entire process much more efficient!
Bonus Tip: This tip is helpful when replacing a field in one location. If you need to replace fields for ALL occurrences throughout the entire workbook, you can use Replace References instead to replace everything all at once. In the Data pane, right-click the field you wish to replace, choose “Replace References,” select the desired replacement field from the menu, and click OK.
Tip 3: Preserve Dashboard Formatting when Swapping Worksheets
Here’s a simple yet powerful Tableau tip for replacing a worksheet on a dashboard with just a click—without losing any of your carefully crafted dashboard formatting! This tip is handy when working with duplicated dashboards. When you manually remove a worksheet from the dashboard and drag and drop a replacement, any unhidden filters, legends, parameters, and other elements also come along with the new worksheet, potentially disrupting the layout or shifting other objects.
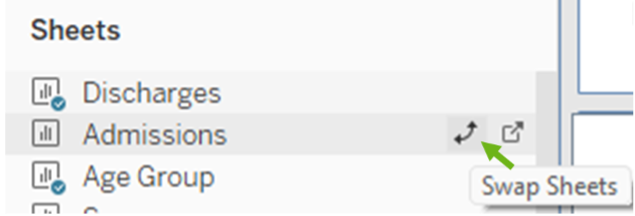
Instead of manually removing and adding sheets, you can swap them with a single click. The best part? All borders, padding, shading, and other formatting applied to the original sheet on the dashboard remain intact, saving you time and effort while keeping everything polished.
To swap sheets seamlessly and preserve formatting, select the worksheet on the dashboard you want to replace. Then, from the Dashboard pane under Sheets to the left of the dashboard, hover your cursor over the name of the replacement worksheet. A small double-ended arrow icon will appear. Clicking this button will swap the two worksheets. There is no need to rearrange the dashboard or reformat the new worksheet!
Tip 4: Copy and Paste Dashboard Objects
Since the 2021.4 release of Tableau Desktop, formatting has been much more manageable! You can effortlessly copy and paste text boxes, images (like logos), buttons, containers, blank objects, and more—all while preserving formatting choices such as padding, background fill, borders, color, and other style settings, ensuring your designs stay consistent. Even better, you can transfer these items between different workbooks without losing any formatting, helping you maintain a polished and cohesive look across your projects.
Simply right-click on the object you wish to copy or select the More Options ▼ down arrow at the top right of the object and select Copy Dashboard Item.
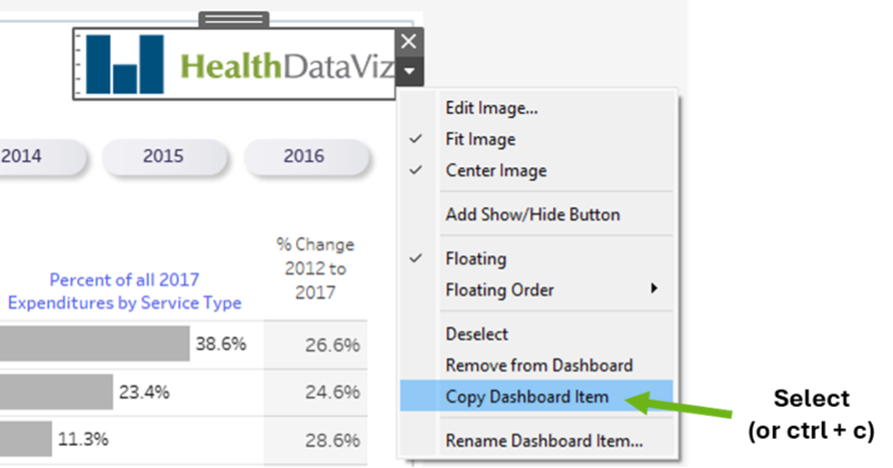
Then, go to File and select Paste. Or to save even more time, use keyboard shortcuts (ctrl + c and ctrl + v) instead to copy and paste objects.
Note: Objects pasted using this tip will automatically be “floating” on your dashboard even if the original object was tiled. If the pasted object needs to be tiled as well, either hold down the shift key as you position it or click on the More Options ▼ down arrow and deselect Floating.
Tip 5: Add Gridlines to Dashboards in Development
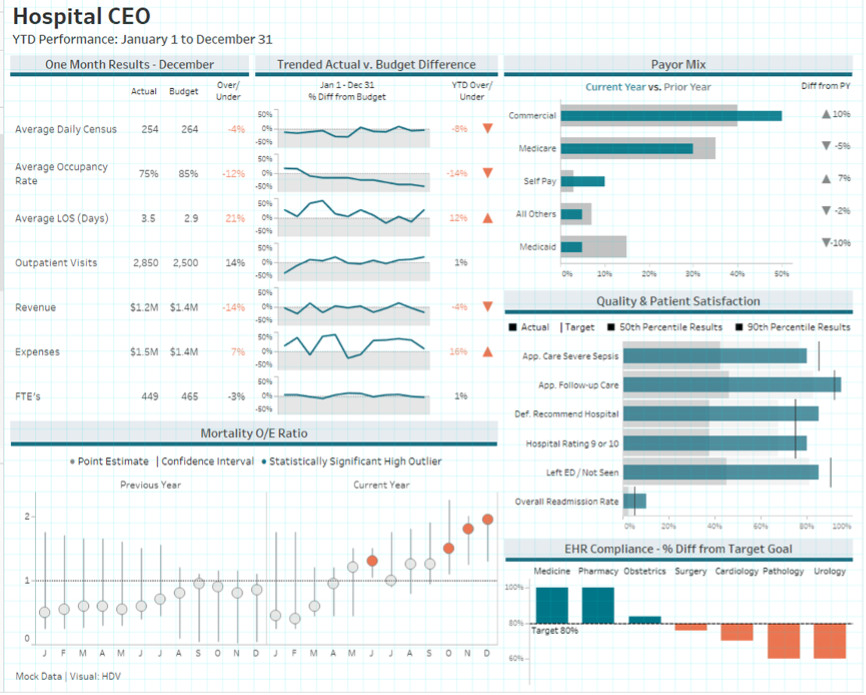
Did you know that pressing the ‘G’ key on your keyboard lets you toggle the grid overlay while building a dashboard? This simple shortcut can be a game-changer, helping you maintain a neat and organized layout as you work with multiple worksheets, dividers, buttons, images, and other dashboard objects. It’s a quick and easy way to ensure everything is perfectly aligned and visually cohesive.
Tip 6: Format Worksheet Tooltips From a Dashboard
You don’t need to dig into individual sheets for minor tooltip adjustments! Select the sheet in the dashboard, click Worksheet in the top menu, and choose Tooltip. The Edit Tooltip window will open, allowing you to make changes quickly and easily. If you need to add fields, you’ll still do that at the worksheet level, but formatting your tooltips from the dashboard remains quick and straightforward.
In Summary
These Tableau formatting tricks can save time while keeping your dashboards polished and professional. By streamlining your workflow, you can focus more on the critical insights. Whether refining a single visualization or managing multiple projects, these tips help you work faster without sacrificing quality. With more time, you can create stunning, easy-to-understand visualizations that make an impact!



0 Comments