The Center for Disease Control and Prevention (CDC) has been pivotal in the nation’s mission to address and understand the health of our communities and citizens. As part of that mission, the CDC has worked with states to collect data to better respond to national and local trends. The Department of Health in the District of Columbia (DC Health) has participated in a number of these data collection activities, including the two we are showcasing in this post: opioid overdoses and firearm injuries.
DC Opioid Overdose Dashboard
HealthDataViz and DC Health led a team comprised of multiple DC government offices and agencies to create a comprehensive series of dashboards around the opioid epidemic in DC. Previously, each office and agency would share their individual reports and data in different formats and frequencies. By creating a cross-agency collaborative team, DC now has a central report for better, more timely opioid overdose data sharing.
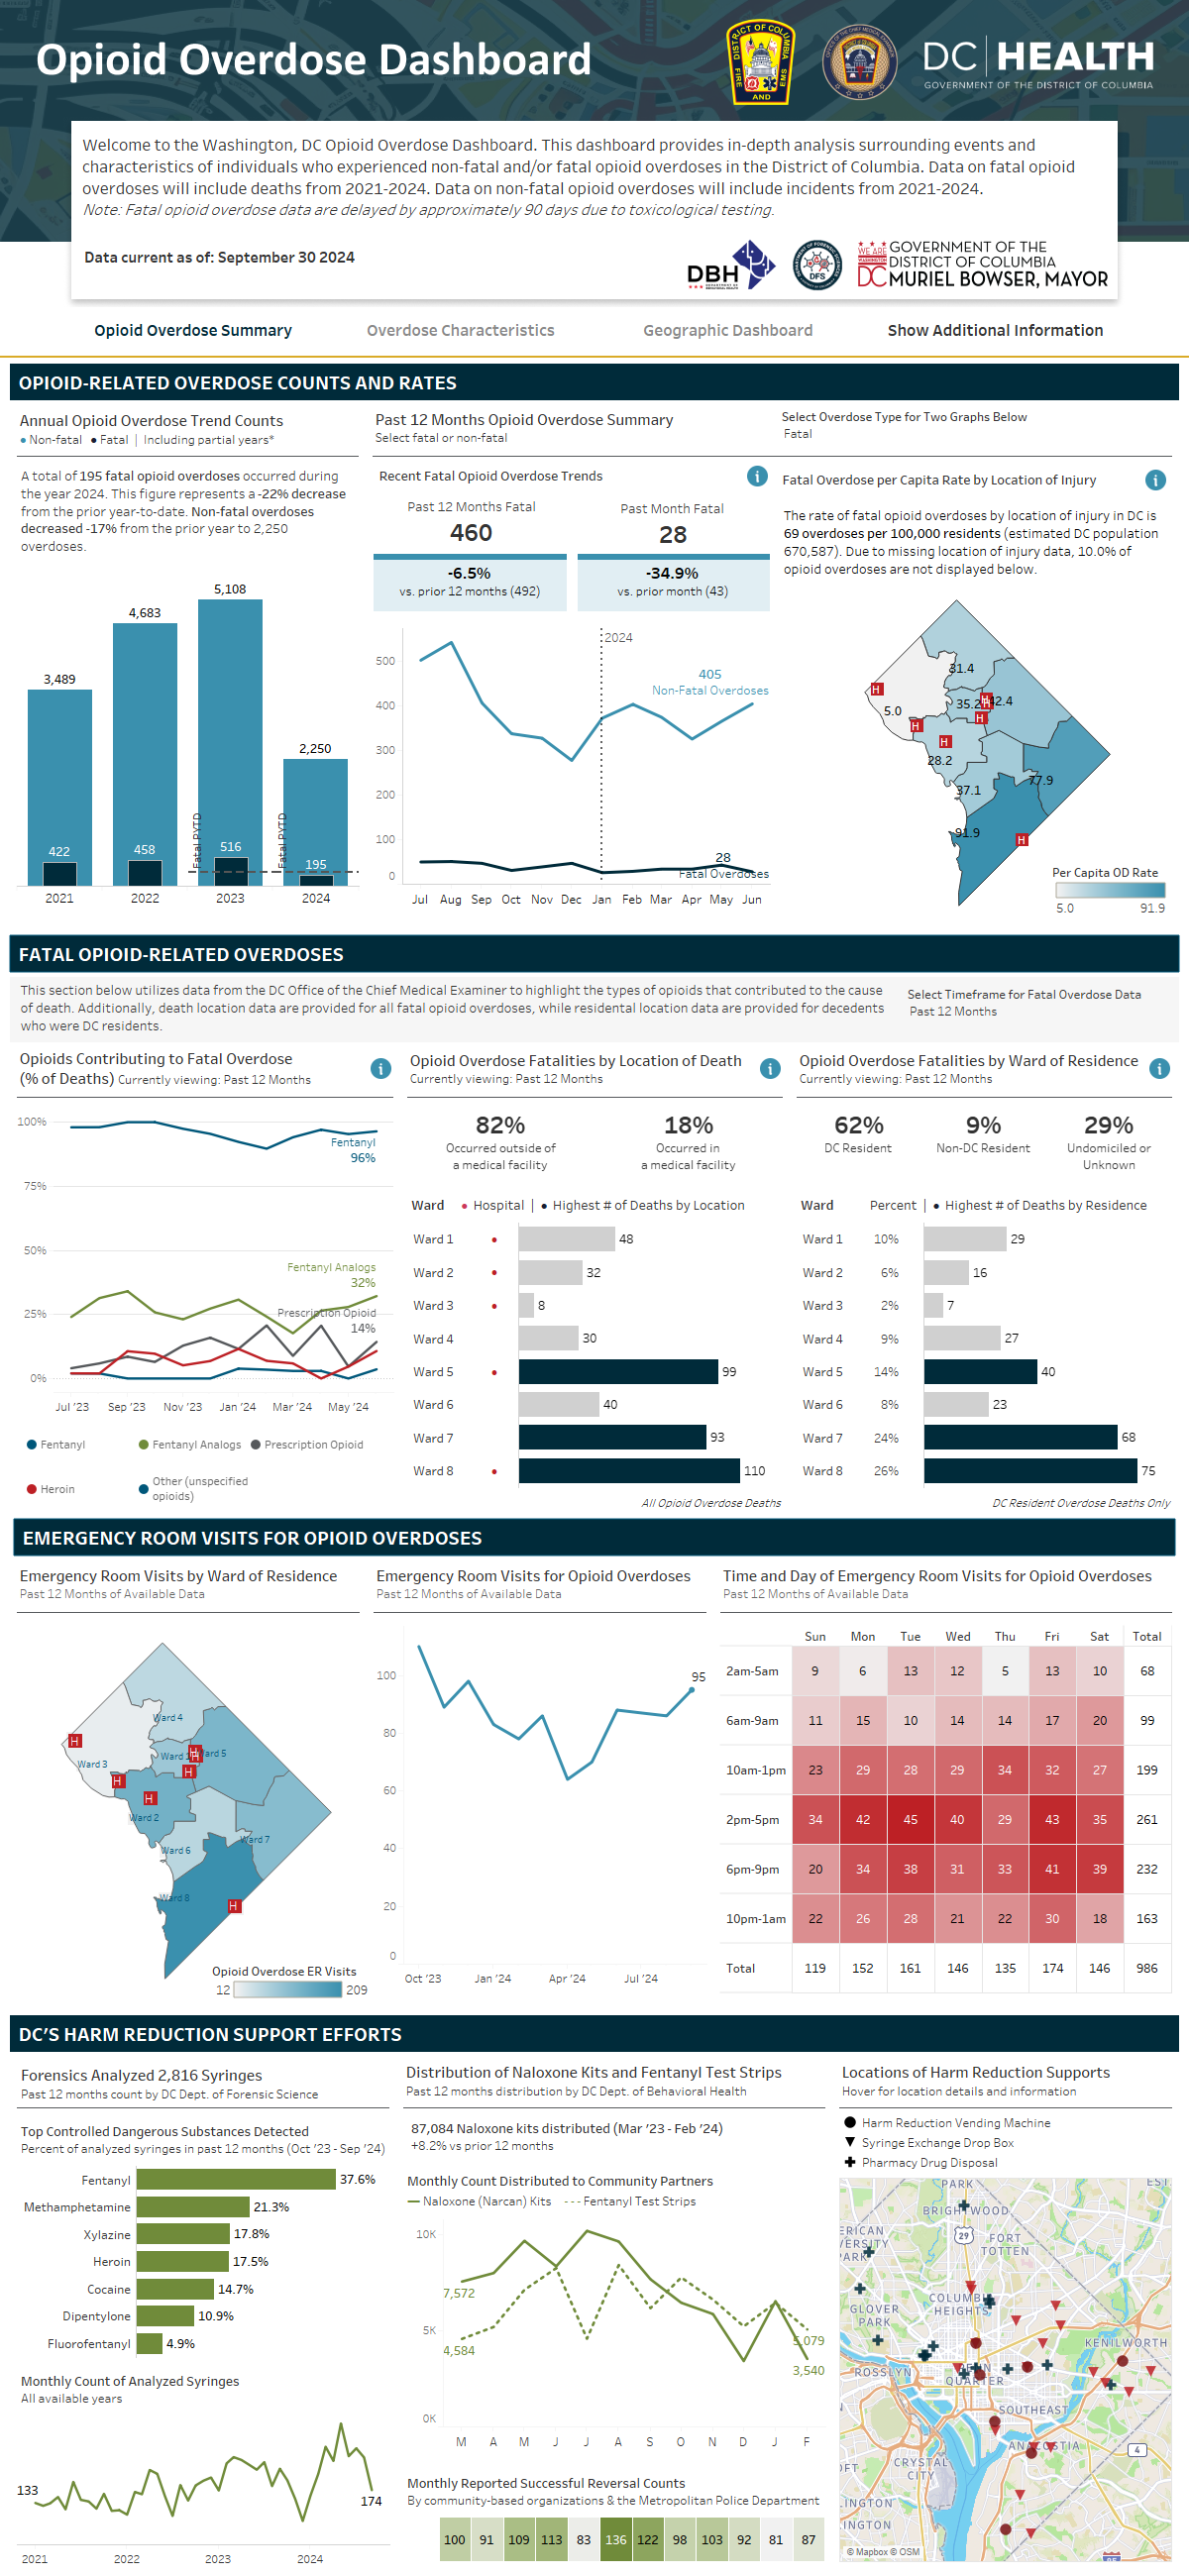
DC Health Opioid Dashboard as of November 2024
The dashboards focus on non-fatal overdose data from FEMS (Fire and EMS) and fatal overdose data from the Office of the Chief Medical Examiner. The summary dashboard looks at the overdose data over time and provides additional information from DC’s emergency rooms and harm reduction support efforts. By itself, this dashboard provides a strong understanding of how the opioid overdose epidemic has changed over time in DC and how different wards have been impacted.
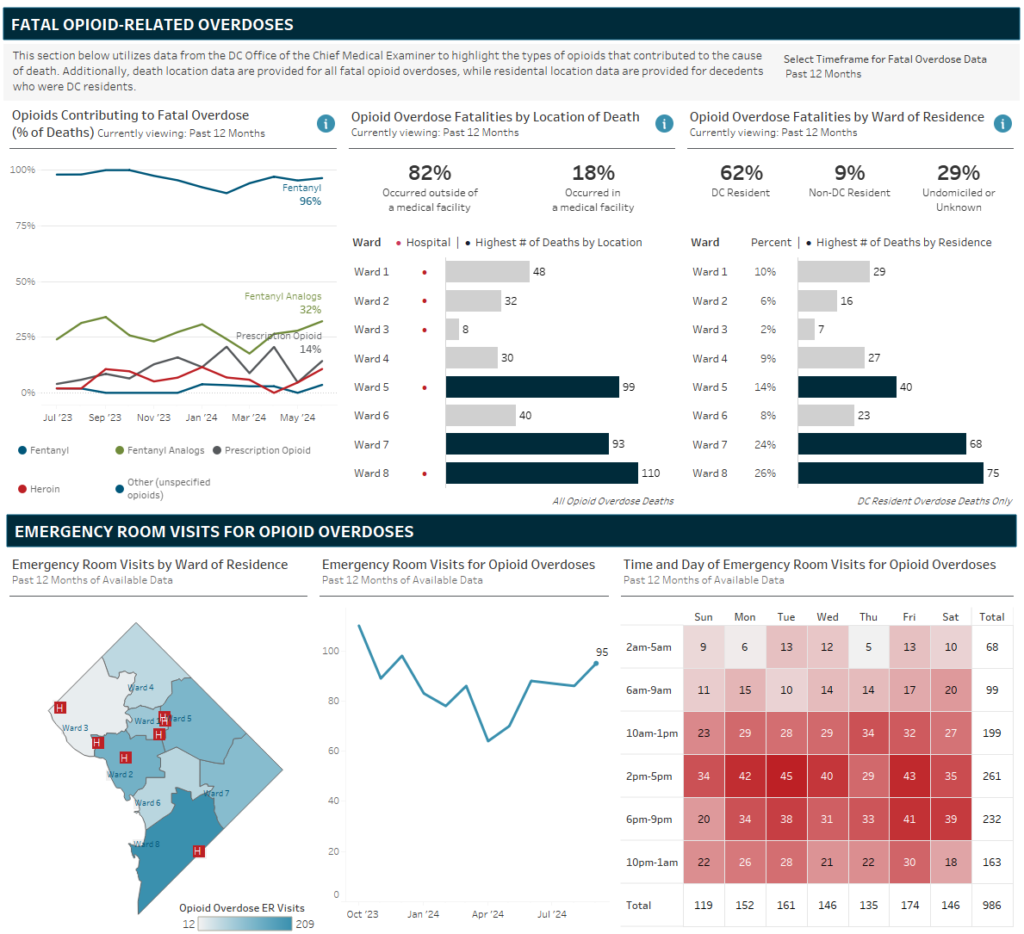
The second dashboard, Overdose Characteristics, describes the demographics of individuals who have experienced an opioid overdose. The default bar chart view intentionally mirrors reports that DC Health has published in the past to disseminate opioid overdose data to the public. Bringing those elements into Tableau with more automated and frequently updated data improves public access to the data and reduces time spent by DC staff creating static reports.
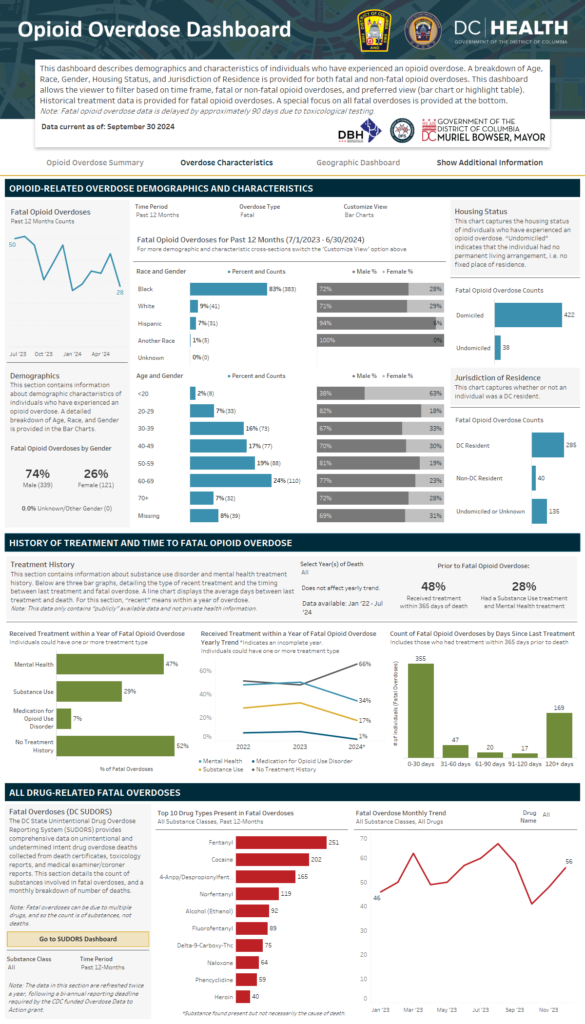
DC Health Opioid Dashboard as of November 2024
The alternate highlight table view provides more intersections of the demographic categories and more flexibility than the previous PDF reports. The DC Department of Behavioral Health contributed data on the treatment status of individuals who experienced a fatal overdose. This data helps provide a better picture of the people impacted beyond demographics alone.
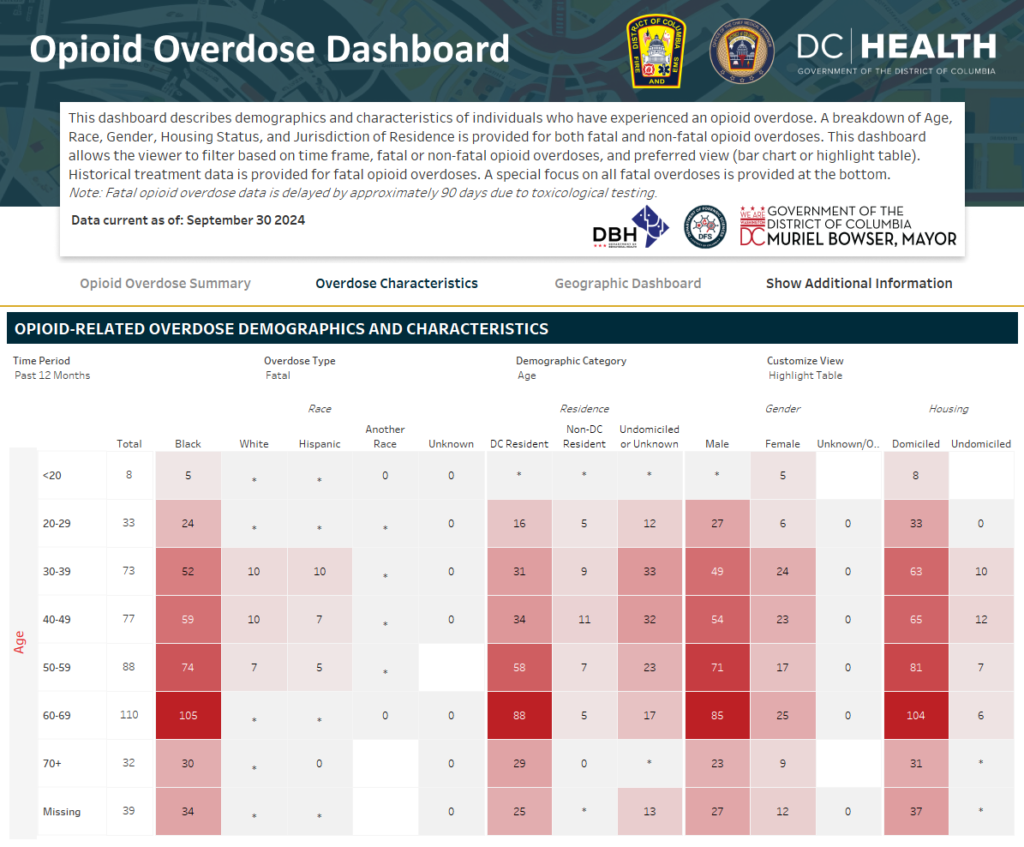
DC Health Opioid Dashboard as of November 2024
The third dashboard, Geographic Dashboard, centers on a highly customizable map of DC. Users can adjust the geography type to Ward, ZIP Code, or health planning neighborhood, choose between counts or rates, and aggregate the data by location of injury or location of residence. Around the map are charts that help describe the data shown. At the bottom of the dashboard, users can look at toxicology, timing, and location data for an individual area.
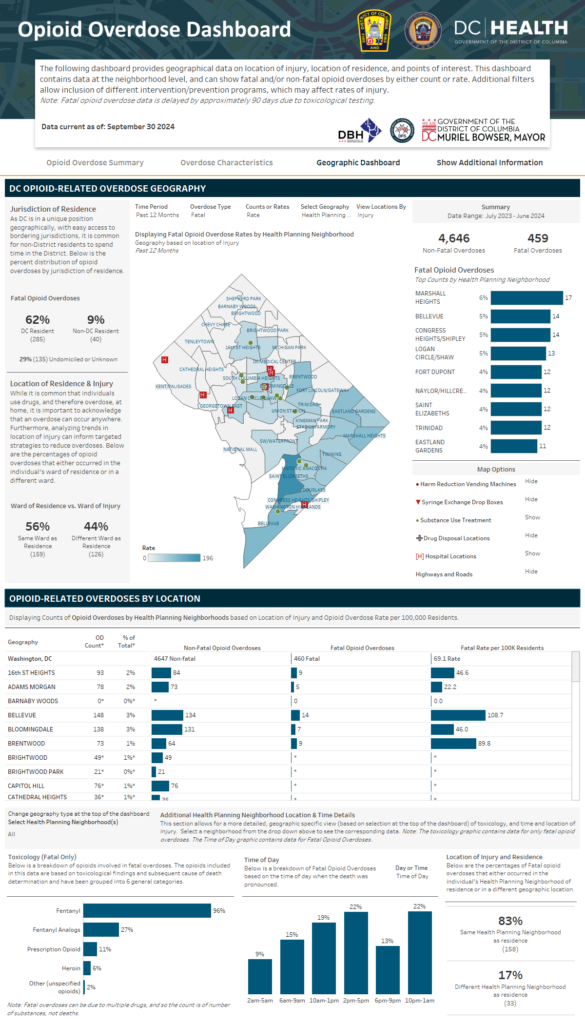
DC Health Opioid Dashboard as of November 2024
DC FASTER
DC was one of ten original recipients of the CDC’s Firearm Injury Surveillance Through Emergency Rooms (FASTER) program in 2020 (there are 12 total participants in 2023). This program aimed to revolutionize firearm injury surveillance by using existing emergency room surveillance data, traditionally used by the CDC for monitoring communicable diseases and other potential disease outbreaks, for real-time insights of firearm injuries.
As DC Health states on their website, timely reporting at the city level through FASTER, allows the District to detect surges in gun violence, monitor the victimization of at-risk groups, and understand trends in firearm injury.
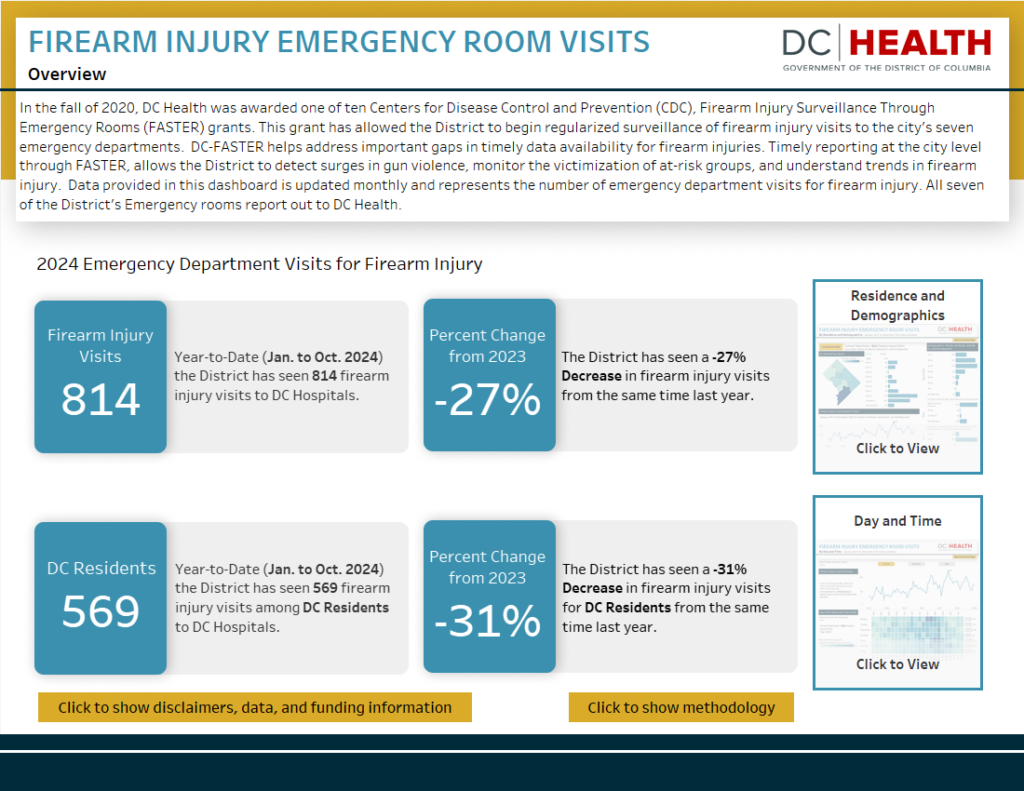
DC Health FASTER Dashboard as of November 2024
As part of their proposal, DC Health needed a data dashboard to share with the public. They engaged HealthDataViz to create dashboards that are as innovative as the program itself.
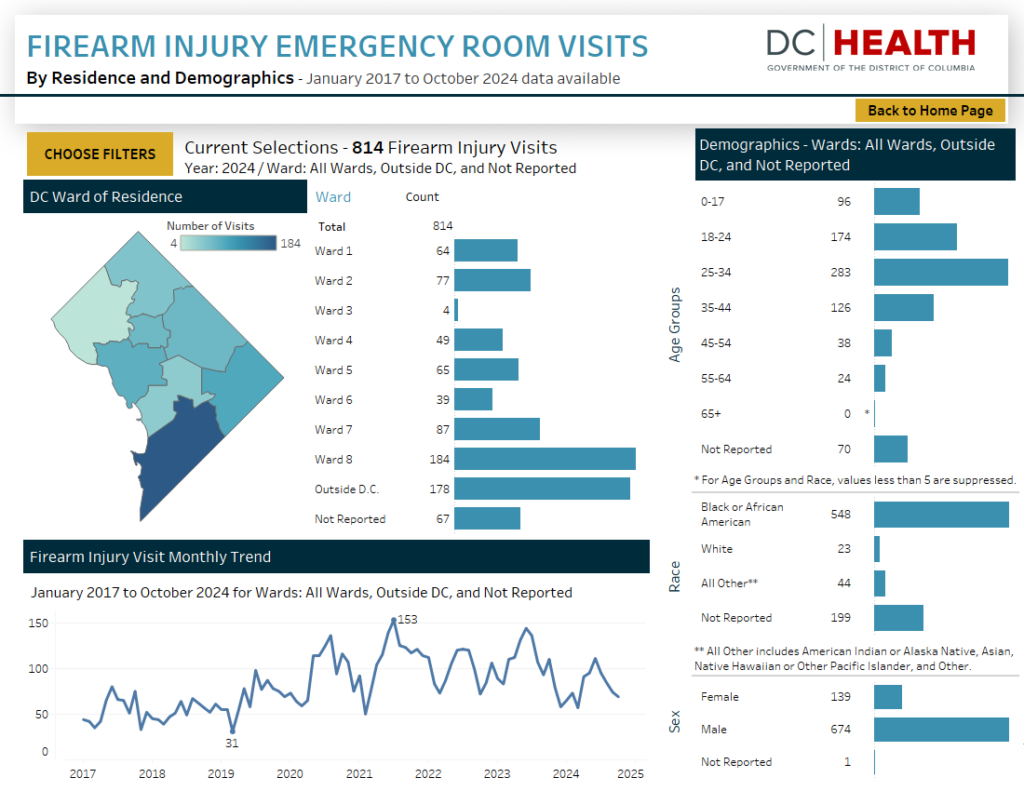
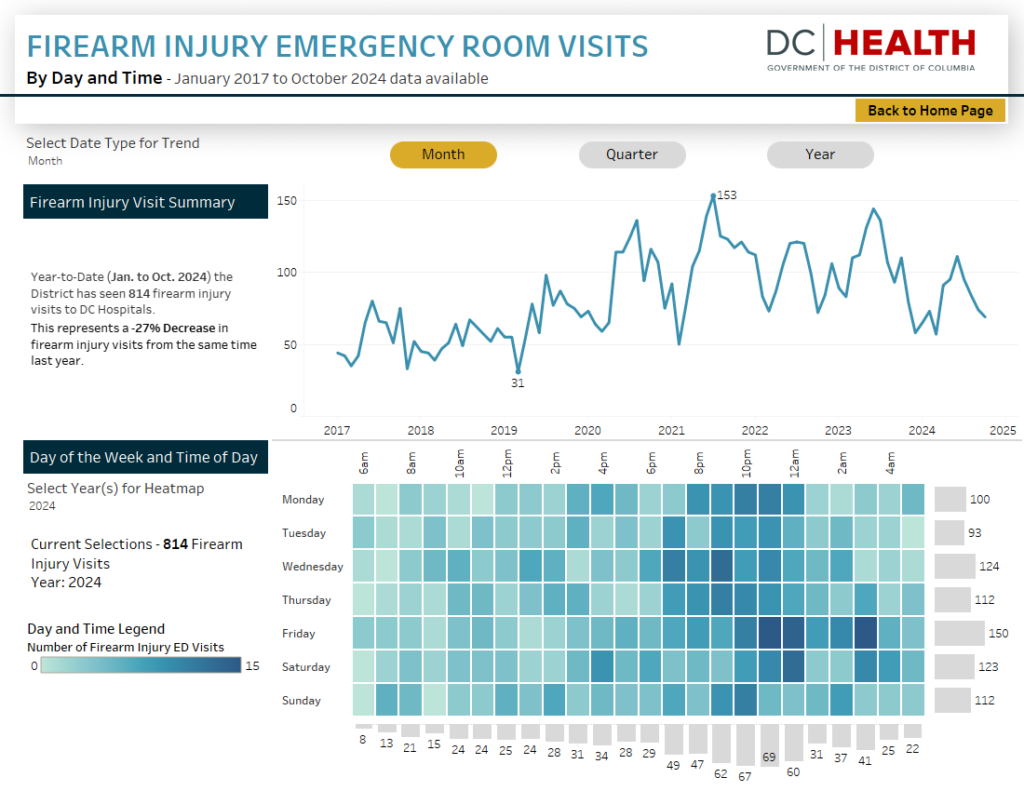
There are three total dashboards: a summary that provides necessary program information (figure above), a residence and demographics dashboard, and a novel day and time dashboard (figures below). The residence and demographics dashboard, as it sounds, provides data by the ward and ZIP code of residence of those impacted by firearm injury. The day and time dashboard is unique among the twelve FASTER recipients by presenting data by the day of the week and time of day of the emergency department visit – the data on ‘when’ to complement the classic ‘where’ data.
Interested in More?
Check out our portfolio to see more of our public-facing work. We’d love to work with you on your next project! Please get in touch with us if you have questions.
If you missed our other post about our work with DC Health, check out the post by Technical Trainer and Consultant Katie Bueno.

0 Comments