I think (and hope) that I’m exceptionally open to new ideas and to change — but if I’m brutally honest, I must also acknowledge that there are times when my inner skeptic whispers (OK, shouts), “change is good — you go first!”
Maybe there’s something in my Myers Briggs Type (I’m an ENFJ) that can explain this tendency (or maybe not); regardless, I recognize that I often need to research, discuss, and think about a new concept before I’m ready to embrace it. Will I decide, “that’s a knuckleheaded idea, and hell no, I won’t go”? Or will it be, “you idiot — why didn’t you think of that?”?
Case in point: the tried and true (and my favorite for displaying geospatial data) Choropleth Map vs. the new (and not my favorite, though rather sexy) Hex-Tile Map.
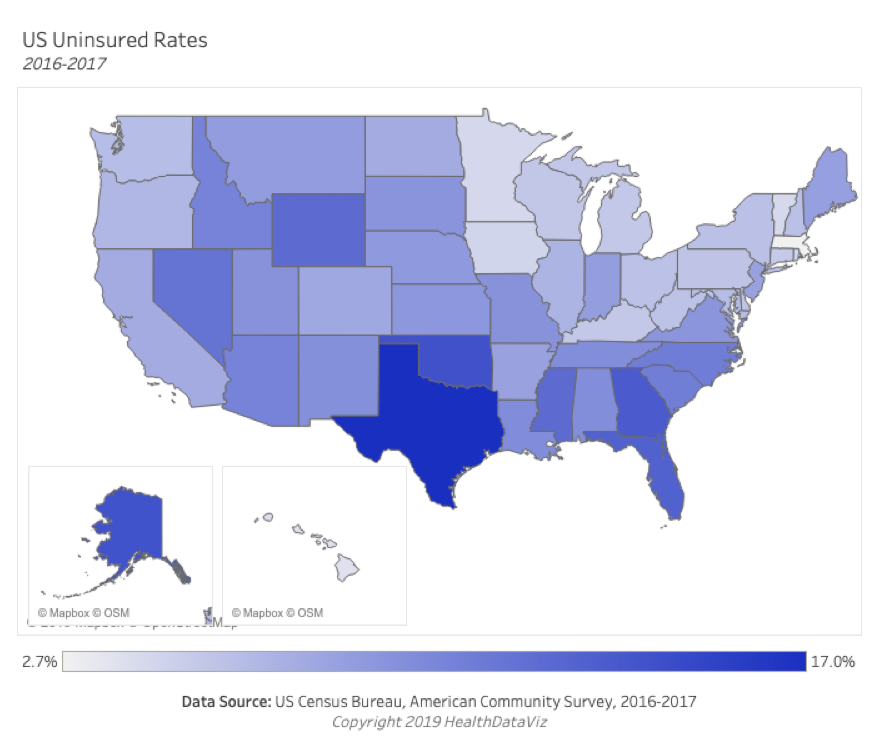
Let’s start with the Choropleth Map, and why it works so well. A Choropleth (from the Greek words for “area/region” and “multitude”) is a thematic map in which areas are shaded or patterned in proportion to the measurement of the statistical variable being displayed, such as population density, or in the example below, rates of uninsured adults in the U.S.
Choropleth Maps provide an easy way to visualize how a measurement varies across a geographic area, or to show the level of variability within a region. Dark saturations of a color represent higher values; lower saturations, lower ones.
In the following display of uninsured adults (captured by the 2016-2017 U.S. Census Bureau, American Community Survey) we can see from the darkness of the blue that Texas has the highest uninsured rate (about 17%), while the lightest saturation of blue is in Massachusetts, where we enjoy an uninsured rate of about 2.7%.
(If we wanted to show the exact rates captured by the survey, we could add those numbers to the map. For the purposes of this newsletter, I will let the saturation of colors supported by the key speak for itself.)
The power of this display is that it allows the viewer to quickly and easily see and understand where the higher and lower rates of uninsured adults are across the country — to grasp and process the data at a glance. I also like being able to see each state in a way that is familiar to me: that is, each one has its actual map shape, showing its size, borders, and relation to other states.
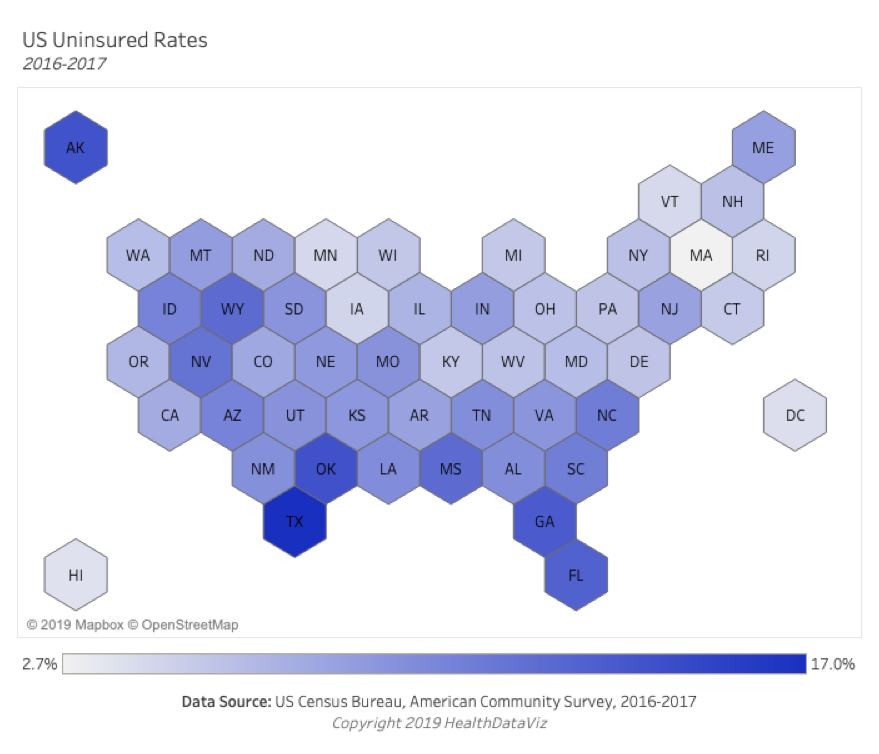
Next, let’s consider the genesis of the Hex-Tile Map, as well as those few instances when I can accept that it may be useful. Most often associated with game-board design (remember Dungeons and Dragons?), a Hex-Tile Map (short for the six-sided hexagon shape) has the advantage of all its shapes being identical in size, eliminating any potential incorrect perception about the proportions of the information being displayed on a traditional geographic map.
The Hex-Tile Map helps us reduce or eliminate what is sometimes referred to as “the Alaska Effect”: the distraction or misperception caused by Alaska’s being really big (twice the size of Texas), and far away from the lower 48.
Further, some will argue that because states in the eastern U.S., especially those along the Northeast seaboard, are typically far smaller than those in the western section, it harder to see those states’ shapes, and read|analyze the values being displayed. Here is the same data displayed above in a Choropleth Map presented in a Hex-Tile Map.
The advantages I’ve cited of the newer type of map haven’t so far persuaded me to trade in my Choropleth for a Hex-Tile when presenting this type of rate data. I must admit however that Hex-Tiles sometimes offer a good medium in which to display simple “yes/no” data, and give designs a fresh, modern feel.
Consider the display below of states that have and have not expanded Medicaid under the Affordable Care Act (ACA): there’s no doubt that it’s very easy to see each state’s status, and to consider and analyze the information quickly and easily.
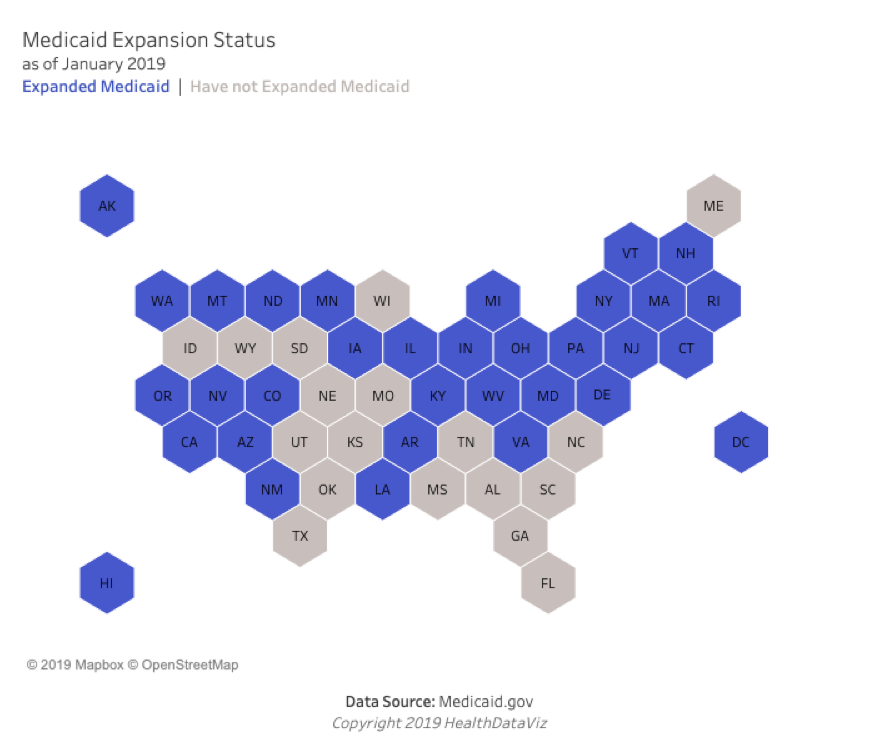
Additionally, when made interactive to serve as a filtering or navigation tool in a multi-faceted display, Hex-Tiles provide a nice alternative to drop-down lists and radio buttons.
Choropleth maps were a complete game-changer when they were used by Dr. Jack Wennberg to show unexplained variations in healthcare delivery in the U.S. (Take a look at The Dartmouth Atlas of Health Care). Their impact has been profound, raising our awareness about the disparities and variations of care delivery in the U.S. system, and moving people to question the status quo. I found them so thoroughly captivating that I quit my job and went back to graduate school for a second time, changing the focus and trajectory of my career (talk about change!).
I may be (slowly) coming around to the value and effectiveness of Hex-Tile Maps under certain limited circumstances, and at the end of the day I do see a few simple uses for them.
And what the Hex — a little bit of change never hurt anyone… much.


0 Comments