For example, on this excursion, Bret and I talked about Trapped Under the Sea, Neil Swidey’s riveting book about the nearly-10-mile-long Deer Island Tunnel, built hundreds of feet below the ocean floor in Massachusetts Bay. It helped transform the Harbor from the dirtiest in the country to the cleanest – and its construction led to the tragic (and completely avoidable) deaths of five men.
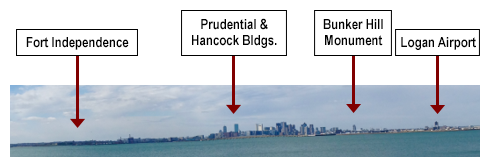
As we rounded the southwest corner of the island, Boston revealed itself to us, and we stopped to see how many landmarks we could identify, along with an interesting fact about each to liven things up (yes, we do try to one-up each other).
We’ve done this numerous times over the years, but on this occasion, the exercise started me thinking about what I was seeing in an entirely new and different way. I began on my left looking at Fort Independence, then moved my eyes to the right to see the Prudential and John Hancock buildings, then the Bunker Hill Monument, followed by the Zakim Bunker Hill Memorial Bridge and the Logan Airport Control Tower.
That’s when it hit me: I was creating sentences and weaving them into a narrative about my beloved city using visual landmarks as cues, just as I do with my healthcare data visualizations.
I’ve developed a habit when I’m designing or testing reports and dashboards: I imagine that I’m in front of the individual or group they’re intended for. Speaking aloud (yes, I do talk to myself on a regular basis), I practice to test whether, using the figures and graphs as my guide, I can create a cohesive, fluent, and compelling narrative.
The reason I do this (and that I encourage you to do it, too) is that I’ve learned that if I can tell a guided story about the data and information on the reports and dashboards I’m designing, then the people in my intended audience will be able to as well. Conversely, if I find myself struggling and stumbling, then I know I need to go back to the drawing board and either refine what I’ve created or, yes, ditch it and start over.
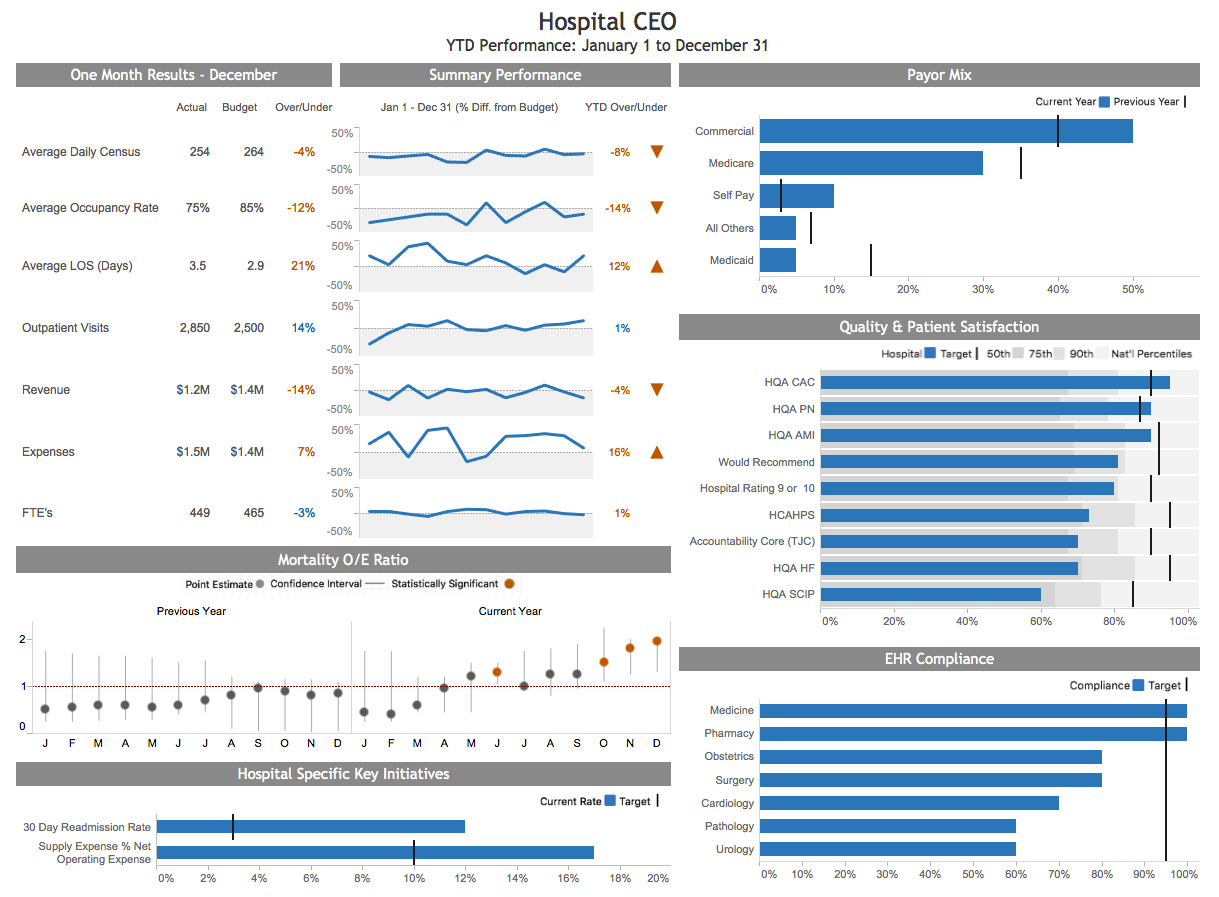
Consider the following prototype CEO Monitoring Dashboard that my team and I at HealthDataViz (HDV) created using fabricated data. I’ve added a few examples of the sentences and narrative I wrote as we were developing and testing it.
I always begin my descriptions with an introduction or executive summary about the level of data being displayed (Summary Overview vs. Subject-Area Specific, for example); the intended audience; and overall objectives and end use.
Next, I carefully survey the data being displayed, moving primarily from left to right and top to bottom – or, depending on the layout of the dashboard and leveraging the way that our eyes cover a page, beginning at the top left, moving to the right and then down the right-hand column and back up along the left-hand one.
Perhaps most important, I include very specific examples supported by data points. Selecting just the right ones for my review may be the hardest and most time-consuming part of this self-check I do, but it is absolutely essential for testing that what I have displayed is correct and makes sense – and that I can explain it in simple, brief terms.
Here is an abbreviated example of what I mean (pretend you’re in the room listening while I practice):
Summary Overview
- This Hospital CEO Dashboard takes into account the current environment in which hospital CEO’s have to navigate – one shaped by Value Based Purchasing (VBP) and public reporting, and where financial, clinical, information technology, and patient satisfaction results are all inextricably linked.
Top Left – One-Month Results and Summary Performance
- On the upper left side of the dashboard, we can see that the Actual Average Daily Census for December was 4% below Budget (254 versus 264); and that as shown in the trend graph, this performance is reflective of the past twelve months’ performance, culminating in a YTD below-budget result of 8%.
Top Right – Payor Mix
- It is also interesting to note changes to the hospital’s year to date (YTD) payor mix displayed in the bar graph at the top right of the dashboard. For example, in the current year, Commercial Insurance represents approximately 50% of all hospital payors as compared to 40% in the previous year.
Middle Right – Quality and Patient Satisfaction
- On the HCAHPS survey question “Would recommend this hospital,” approximately 80% of the patients responding for this specific hospital said “yes” as displayed by the horizontal blue bar. This result misses the hospital’s target of 90% (represented by the vertical black line), and places the hospital in the 75th percentile nation-wide, as signified by the underlying horizontal stacked bar in shades of grey (no, not the movie, people – the bar chart!).
Bottom Right – EHR Compliance
- In this display, we can see that Medicine and Pharmacy are performing better than their target levels at 100% compliance, and that Pathology and Urology have the worst compliance rates, at only 60% each.
Bottom Left – Hospital Specific Key Metrics
- Two specific metrics that the CEO wants to monitor are the hospital’s 30-day readmission rates, and Supply Expenses as a percentage of Net Operating Expenses compared to target.
Middle Left – Mortality O/E Ratio
- This display reveals that for the last three months displayed, the O/E ratios are statistically unusually high (more deaths recorded than we would have expected, and the confidence interval does not include one). In October, the ratio was approximately 1.5; in November 1.8; and by December, it had climbed to 2.0. We have also coded these statistically significant O/E ratios in red to draw attention to them.
I cannot encourage you enough to start using this review-and-read-aloud technique to challenge yourself and clarify whether you have created a dashboard that makes sense and provides insights for your audiences that will lead them to take prompt, effective action. It is a simple, fast, and inexpensive way to get the answers you need for yourself and your own confidence and serenity.
The process may not always be easy: when you have to really, truly describe what you have created in a clear and compelling manner, using detailed explanations with examples from the data, I’ll bet you’ll find it challenging – perhaps even rather frustrating – the first few times you try. But keep at it: in the long run, you will discover that it helps you to create much better and more comprehensive reports and dashboards.
And if you ever need a break to clear your head, I have the perfect walk in mind to do so.


0 Comments