I was whining apologetically to my friend Cindy the other day about being stuck in New Orleans because of Hurricane Sandy. You know — it was the type of whining that’s immediately followed by an apology if you’re hedging your bets about a possible afterlife. I was telling her about having checked out of our hotel and being headed for the airport when my husband got the alert on his phone that our flight had been cancelled. Damn…almost a clean escape — but (literally) “no go.”
Back to the hotel we went — back to check in and wait it out. Later, my friend said something that summed up exactly how I’d felt that day: “You’d had a great trip, but you were done with it.” BINGO! I was done with it. I was ready to go home and get back to my regular schedule. I was done, done, done with New Orleans. And then my thoughts wandered to healthcare (as they always seem to do) and patient re-admission rates within 30 days of a hospital discharge. What a total bummer it is when a patient goes to the hospital for treatment, then is told “You’re good to go home” — only to be re-admitted a short time later.
And just as we were stuck in New Orleans, completely dependent upon the airlines to get us home, these poor patients are stuck back in the hospital and completely dependent upon it to get them home. When patients land right back where they started — re-admitted to the hospital they were just discharged from — it’s a colossal bummer not only for the patient, but also for the hospital and the healthcare system as a whole.
Leaving aside the personal, emotional, and logistical costs to the patient, here’s one reason why it’s so unfortunate: according to published studies, re-admissions to a hospital within 30 days of discharge cause an approximately $17.4 billion-per-year problem in the U.S. alone. An over $17- billion problem that, if not solved by hospitals, will be recovered by payers in the form of significantly reduced payments to them. Clearly, close analysis and hard data are needed to fully understand hospital re-admissions, and to identify all potential opportunities to reduce them significantly. But hospitals’ analysis has tended to look only at overall re-admission rates, which provide a general indication of performance, but don’t enable the type of in-depth analysis required to identify meaningful improvement opportunities.
Here are some (though certainly not all) of the factors that hospitals need to consider when they are analyzing their rates of re-admission:
- During what time-frame are patients being readmitted to the hospital?
- Why are they being readmitted? (Infection, DVT?)
- What treatments and procedures do they undergo during their initial hospitalization?
- Are there any underlying comorbidities?
- Are patients being effectively educated and given full, clear instructions for home care by the nursing staff before leaving the hospital?
- Are patients receiving home health care services?
- Are patients adhering to their drug therapies?
- Are they scheduling and going to follow-up visits with their physicians?
- Did they have effective meetings with, and are they being followed by, clinical case managers?
Hospitals need to dig deeper to find the root causes of the re-admissions and their $17.4 billion cost. Let’s consider one possible approach. Re-admission data can be clearly and tellingly displayed in a histogram, a type of graph that shows the frequency distribution of re-admissions by post-discharge days, and can help pinpoint a post-discharge time-frame of particular interest.
For example: in the histogram below we can see that the post-discharge time-frame “11-15 Days” accounts for the largest number of the hospital’s re-admissions, and may offer the greatest improvement opportunities.

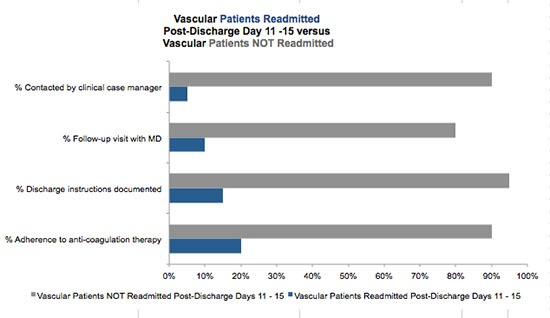
Next, a hospital can search for any particularly revealing similarities or differences between a specific group of re-admitted patients and similar patients who are not being re-admitted. As the Sesame Street song “One of these things is not like the other” suggests, it’s useful to look for those crucial characteristics that help members of the latter group stay out of the hospital when those in the former have to check in again. A display like this one makes it abundantly clear that, for example, re-admitted patients had a different (and largely more negative) post-discharge experience:

- The re-admitted patients are much less likely to have received instructions for home care, or to have been followed by a case manager after discharge.
- They have low rates of follow-up visits and of medication compliance (perhaps they don’t have spouses to lovingly nag and remind them to take their medicines).
Displaying data in this way can really help hospitals analyze accurately and make informed decisions about how to deliver the right care to the right patients at the right time. A histogram or similarly revealing data visualization can empower providers and institutions to get patients out the door and back home to stay.
I am happy (gleeful, actually) to report that in my case, the airlines did a terrific job communicating with us and re-booking our flights, and we arrived home safely and without incident. And although New Orleans was great fun, we aren’t planning to “check back in” there anytime soon. Although I must admit, I muse on the possibilities of a ticket to The Big Easy and $17.4 billion to spend. Nope-too dangerous…


0 Comments