This omission should make you crazy, too. Anytime you see a statistic like this without the accompanying CI’s, you are not seeing the full story, which is: that number can vary — a lot.
During this political season, we are being inundated (please make it stop) with reminders that a reported poll result or statistic may vary. For example: candidate A’s likeableness rating is 50%, while candidate B’s is 46%, with a margin of error (MOE) of +/- 4 points.
Bottom line? It’s a tie; because what the margin of error means is that the actual poll result might be 4 points higher or 4 points lower than the figure being reported. In this case, candidate A’s true rating is most likely between 46% and 54%. This range — from x points below the statistic being reported to x points above that same number — is called the confidence level.
Important note: This difference, or range, is called a level when it is expressed as a percent; it is called an interval for the type of statistic (represented by a figure less than, equal to, or greater than a whole number, expressed as a decimal) that I shall use as an example going forward.
Let’s consider how a confidence interval works in a healthcare report that displays the following information:
Hospital Mortality O/E Ratio = 1.75
That is, hospital “observed” deaths are greater than “expected” deaths.
This ratio tells us that more patients died while receiving care at our hospital than we expected — or does it? The answer depends on the confidence interval, which would provide context for this ratio by telling us how much it can vary. If we see a substantial possible variance, we’ll understand a very different story, and take very different actions from those we might have taken based on the O/E Ratio alone.
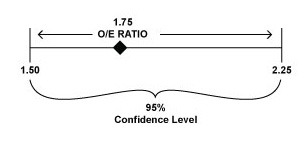
Now let’s consider that hospital Mortality O/E Ratio of 1.75 in the context of a 95% confidence interval of 1.50 to 2.25. By doing so, we can say (with confidence) that if the O/E Ratio is calculated over and over and over (and over) again, the result will fall within the range of 1.50 to 2.25 — 95% of the time.
Next, let’s evaluate the 1.75 Mortality O/E Ratio with two different CI’s at the 95% level and the different stories that each one conveys to us.
- 95% CI = 1.50 to 2.25
This means that we are 95% confident that our O/E ratio may be as low as 1.5 or as high as 2.25.
It also means that we have confidence that more patients are dying in our hospital than we expected (an O/E > 1) and that we need to get to work improving our performance.
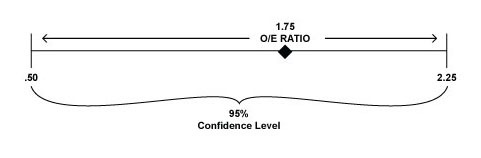
- 95% CI = .50 to 2.25
This means that we are 95% confident that our O/E ratio may be as low as .50 or as high as 2.25.
It also means that we can’t really be certain that more patients are dying in our hospital than we expected (an O/E > 1), nor can we be certain that fewer patients are dying in our hospital than we expected (an O/E < 1).
The CI range is so broad that all we can say about our O/E Ratio here is that we really have no idea how we are doing on our hospital mortality performance measure. We need to have more information about this statistic before we take any action.
It is also important to know at what level the CI was set: not all CI’s are at 95%. They may be at 90%, or 85%, or some other level, depending on the data, the analysis, and the decisions of the statisticians calculating the total. But the result is the same; your confidence in that statistic in the context of the CI is just a bit lower.
And now as I close this newsletter I can say with 100% confidence that I have written as much about this subject as even I can handle in one sitting! Make mine a double.


0 Comments