Recently I was thumbing through Colin Ware’s book Visual Thinking for Design when I was reminded of the expressive power of lines. In his book, Ware shares the following exercise, which was conceived by the Italian psychologist Manfredo Masseroni.
Masseroni wanted to help people understand how the magic of lines can be used as part of the creative design process.
Make a few simple scribbles by moving a pen around in a large irregular looping pattern. Don’t think about anything while you do it.
Here are my scribbles:

Now comes the fun part.
Transform your scribbles into birds by simply adding a small, dark circle and a < shape to any one loop of the scribble. Voila! A bird will appear, and different parts of the scribble will become the bird’s head, tail, body, and even feathers.
What is extraordinary about this exercise is that just about any scribble can become a bird.
Here are my scribbles transformed into birds:
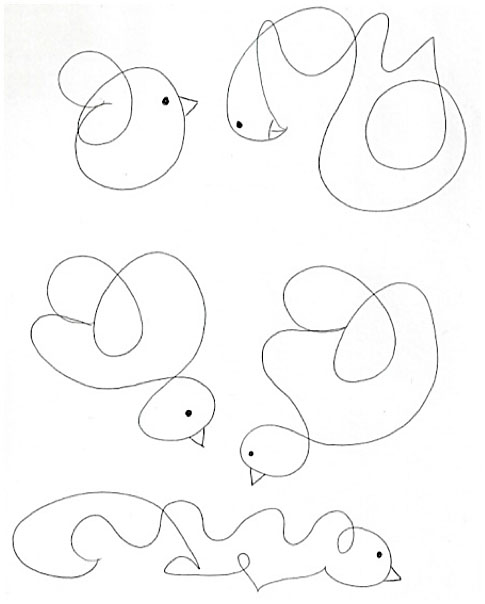
This exercise is of course a great way to amuse small children and fill awkward silences at cocktail parties…(so killer to a great party).
It also makes a couple of additional and more thought-provoking points.
First, it highlights the useful and valuable power of seeing. Simple looping lines become bodies and wings.
Second, and more important, it illustrates an important creative design technique that many artists and designers use, and that can be very helpful in designing your visual displays of healthcare data.
Here’s how:
If we scribble instead of proceeding more methodically and jumping straight to a tool such as Excel, scribbling gives us the freedom to do visual brainstorming. It lets us consider questions, ideas, and designs that we might otherwise have missed.
Scribbling also frees us to experiment in a very low-cost, low-risk, quick-and-easy way: there is no pressure or requirement to “get it right.” Rather, the goal is to see what we can imagine and create with freedom.
Here is a simple example of a table of information that I want to display in a graph:
Percentage of MI Patients on Pre-Operative Medications by Medication Type
| Beta Blockers | Statins | ASA | ACE | ARB | Clopidogrel | |
|---|---|---|---|---|---|---|
| Hospital | 52% | 57% | 49% | 38% | 11% | 8% |
| Comparison | 59% | 57% | 57% | 38% | 12% | 21% |
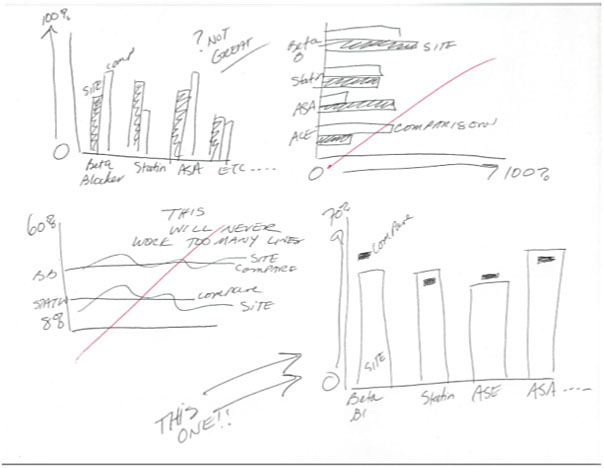
And here are my scribbled ideas, which took me about two minutes, tops:
And here is the graph I created using Excel:
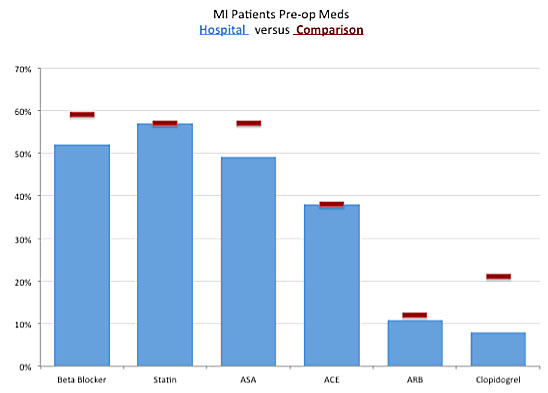
While it is true that I could have experimented in Excel first, it is also true that I would have spent more time than necessary trying to get the labels right and fussing with the details. I would have found myself in the weeds, editing away.
And I would have felt much more invested in everything I created.
Instead, because I used the scribble method and nothing more than pencil and paper, I didn’t worry about those things, and it took me no time at all to run through my options. I was free to simply construct, organize, and evaluate ideas.
I was also free to crumple and toss my scribbles without regret.
The important gains in all this are the freedom that scribbling and sketching afford you, and the power to see your options easily and quickly with nothing more than a pencil and a scrap of paper.
Oh, and if by chance you ever do decide to try out the bird scribble at a cocktail party, I highly recommend that you categorize and display the results stratified by number of cocktails consumed. You’ll be amazed at how something so simple can liven up a perfectly dull party in no time.


0 Comments