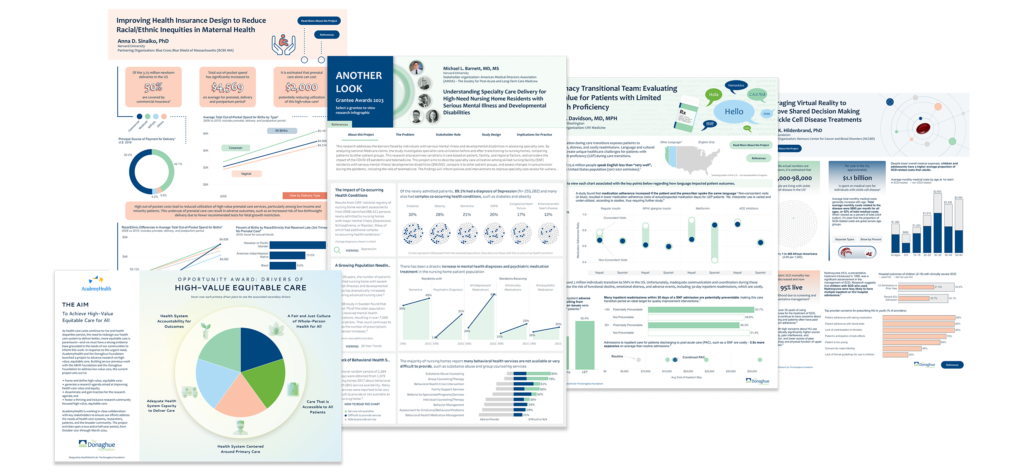
Donaghue Foundation Infographics
HDV created a series of interactive infographics to communicate information on annual grantee’s research projects along with the Donaghue Foundation’s aim to achieve high-value equitable care for all.
Created in collaboration with The Donaghue Foundation using Tableau and Figma

Firearm Injury Surveillance (FASTER)
DC Health engaged the HDV team to create this Firearm Injury Surveillance Through Emergency Room (FASTER) dashboard which allows the District to detect surges in gun violence and monitor victimization of at-risk groups.
Created in collaboration with DC Health using Tableau and Figma

Malaria Behavior Survey
“This dashboard is like a Swiss Army Knife,” according to Johns Hopkins CCP Senior Program Director. With a mobile-first display, this dashboard synthesizes important malaria behavior survey research data to empower program planners in African countries to easily understand key findings and strategies to combat malaria.
Created in collaboration with Johns Hopkins Center for Communication Programs using Tableau and Figma
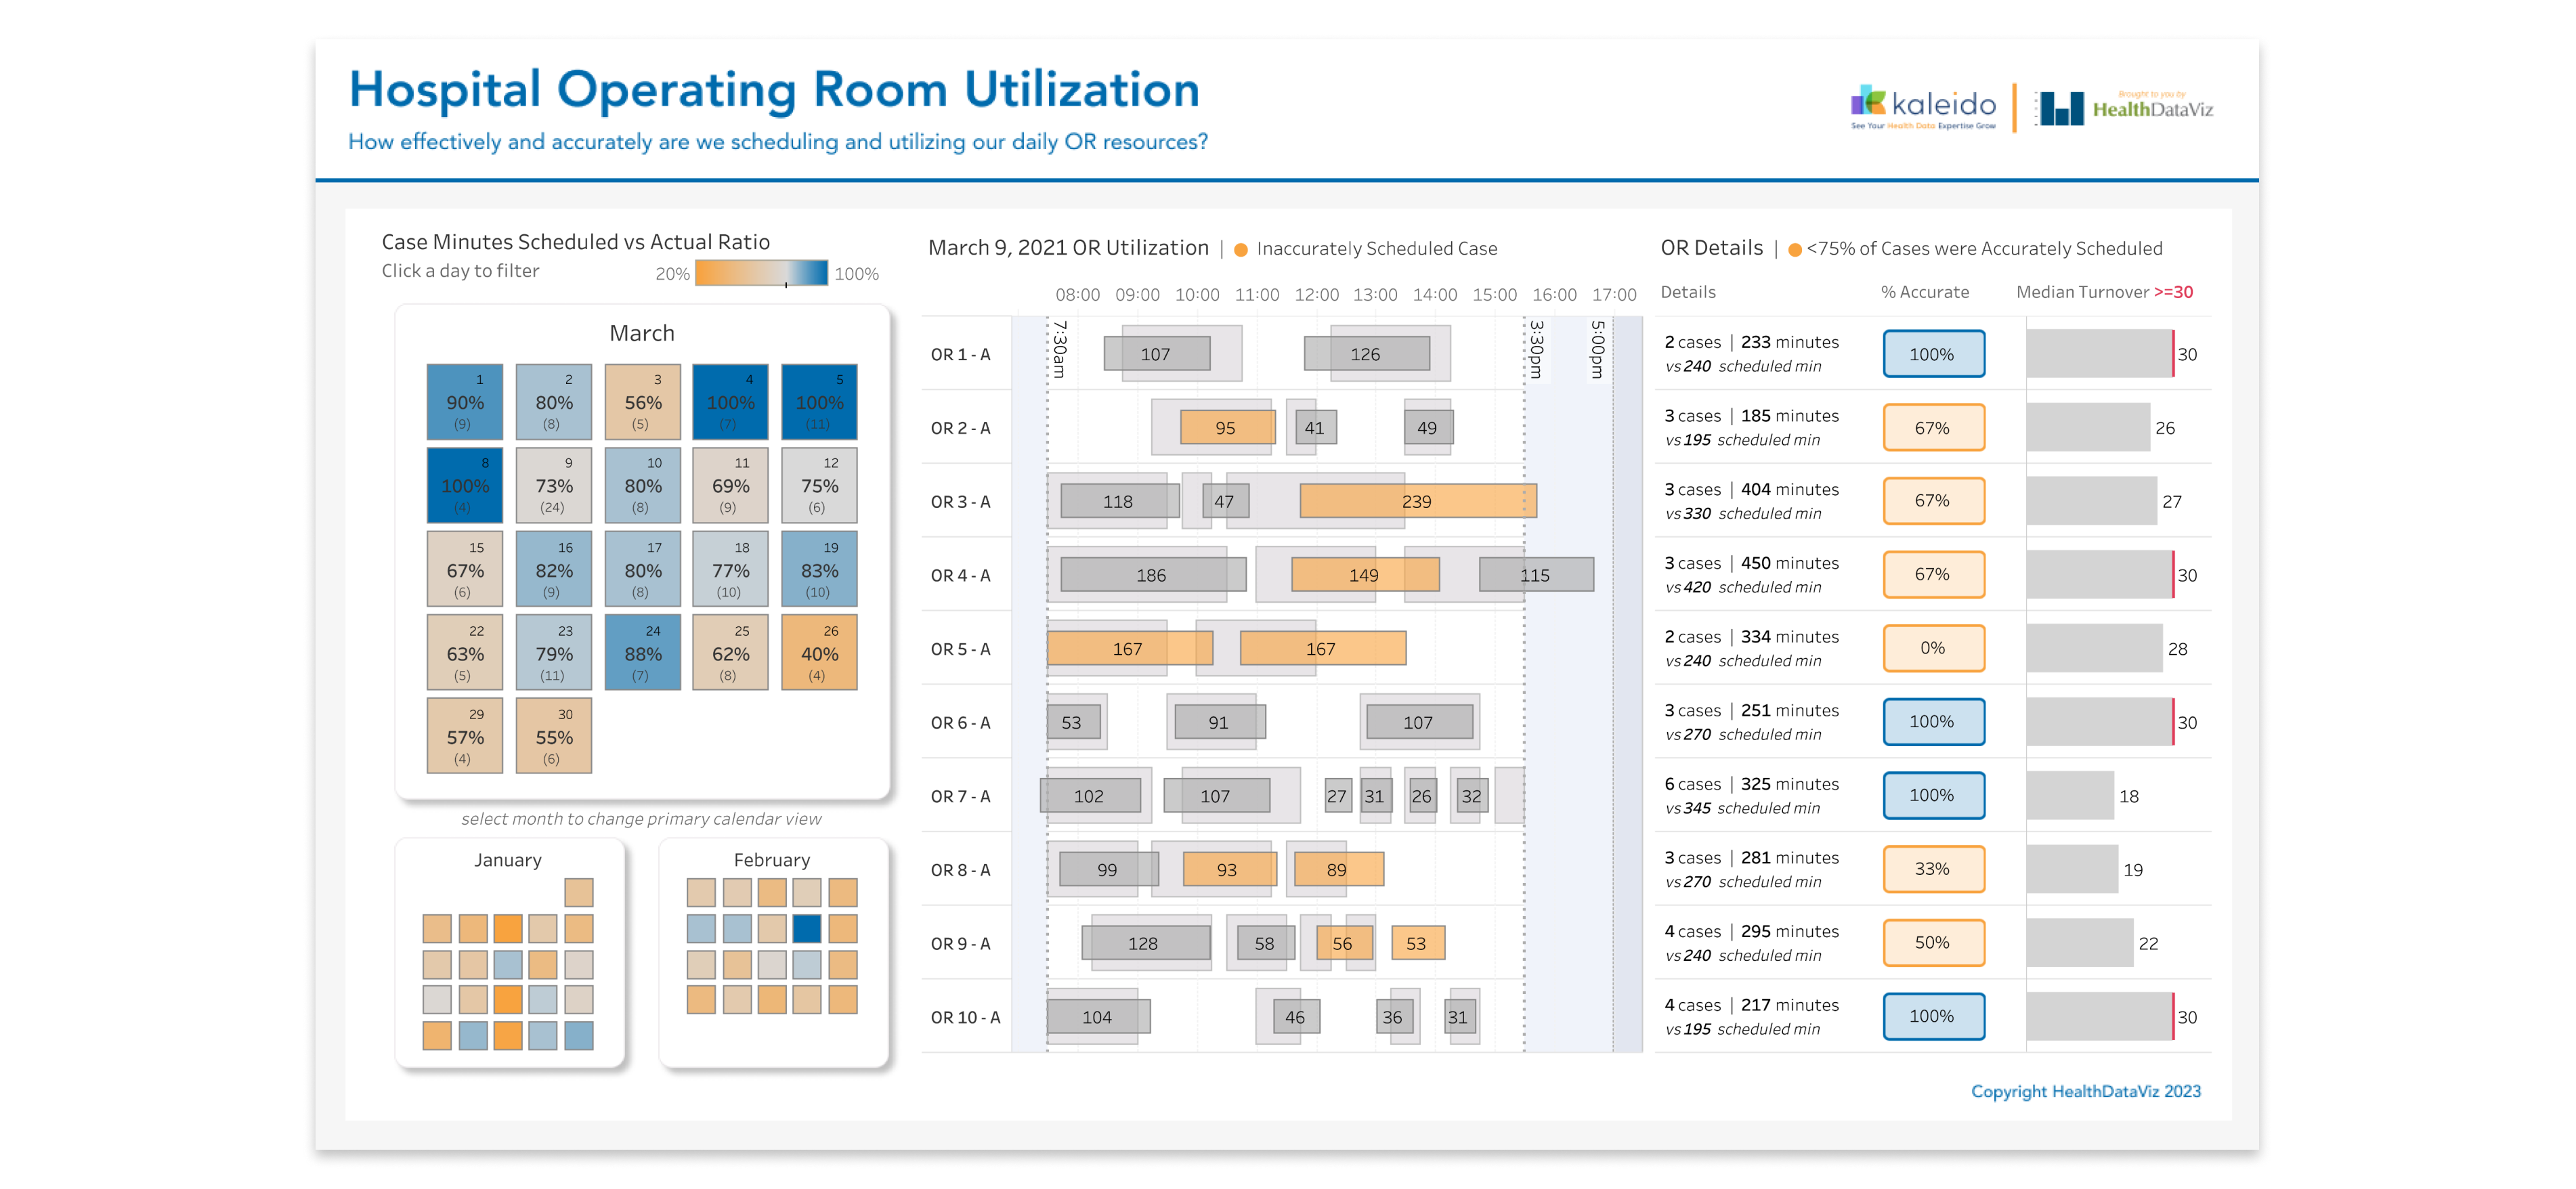
Hospital Operation Room Utilization
Using mock data in Tableau with Figma, members of the HDV team used their extensive experience working with hospitals and surgeons to create an OR block time, surgical scheduling, and utilization dashboard featuring custom calendar views.
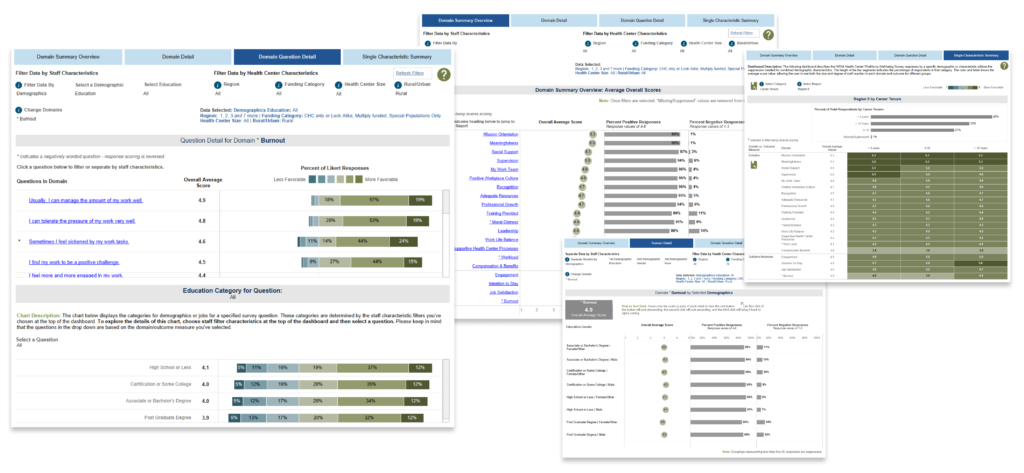
Workforce Well-Being Survey
Using workforce survey data on well-being, engagement, satisfaction, and burnout levels in HRSA-funded health centers, HDV created views allowing users to view domain and question-specific results by different demographic and staff characteristics.
Created in collaboration with Health Resources & Services Administration and JSI using Tableau
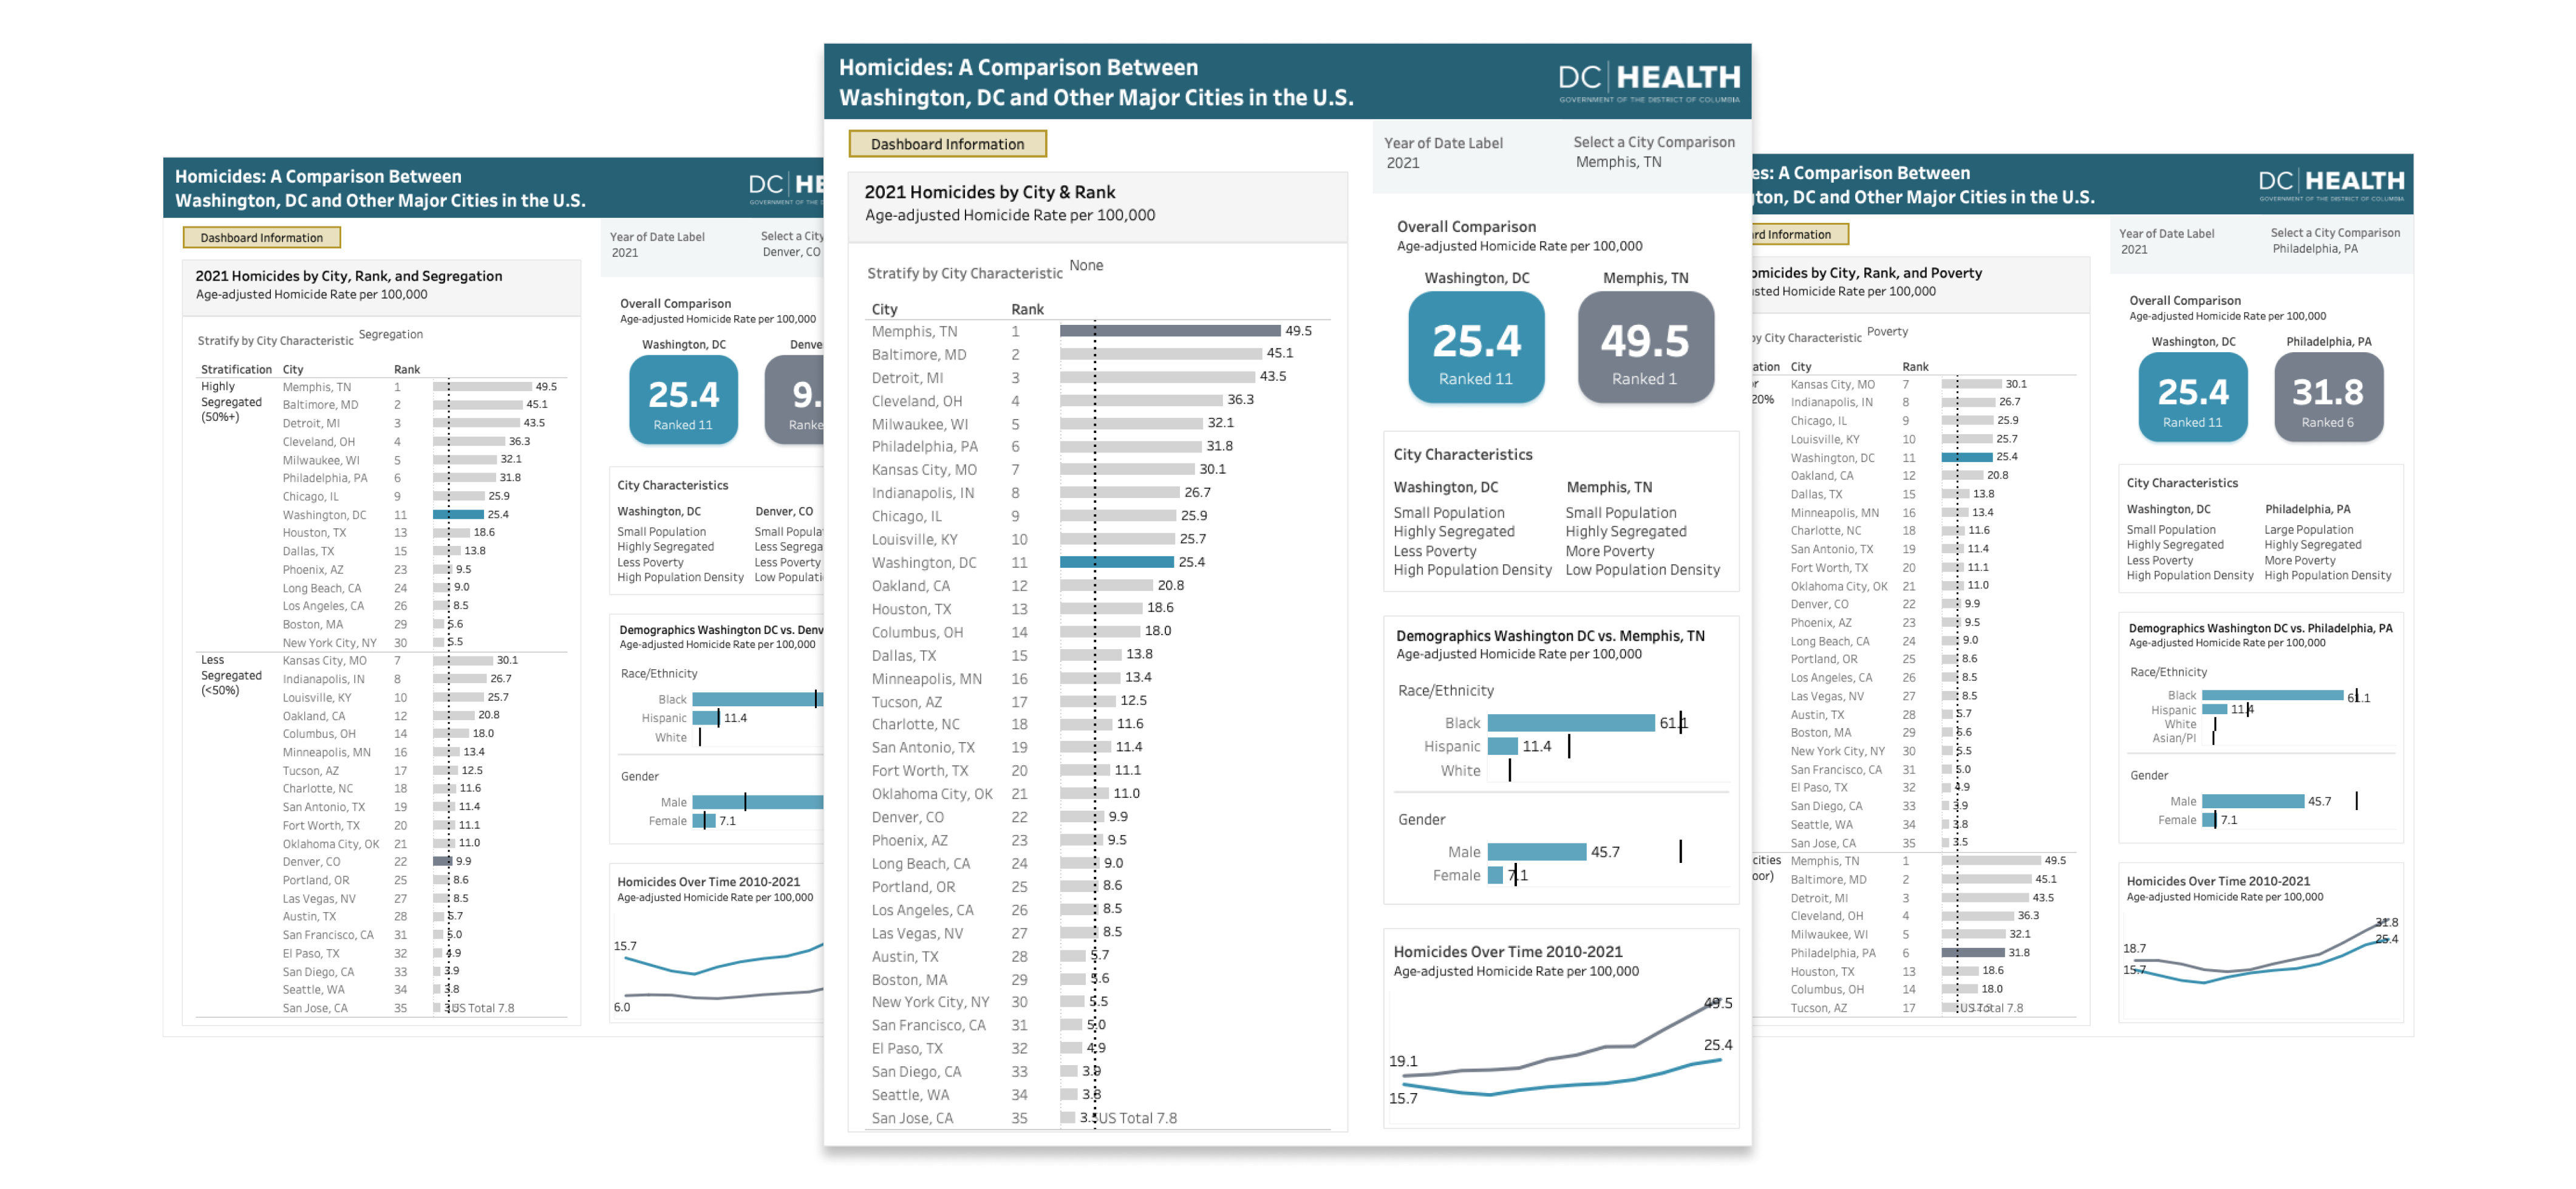
DC Homicides: A Comparison to Major Cities
An interactive infographic displaying homicide age-adjusted rates using data from The Big Cities Health Inventory Data Platform. The focus is comparing Washington, DC to other major U.S. cities with functionality to stratify by population size and poverty.
Created in collaboration with DC Health using Tableau.
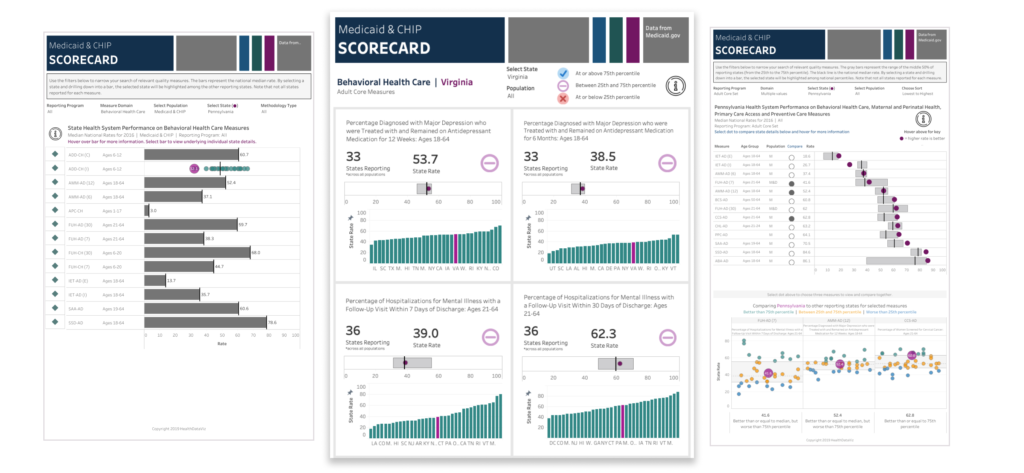
Medicaid and CHIP Comparitive Metrics
Using CMS State Medicaid data, HealthDataViz created this interactive display to help each state and the public compare descriptive and HEDIS quality performance data using Tableau.
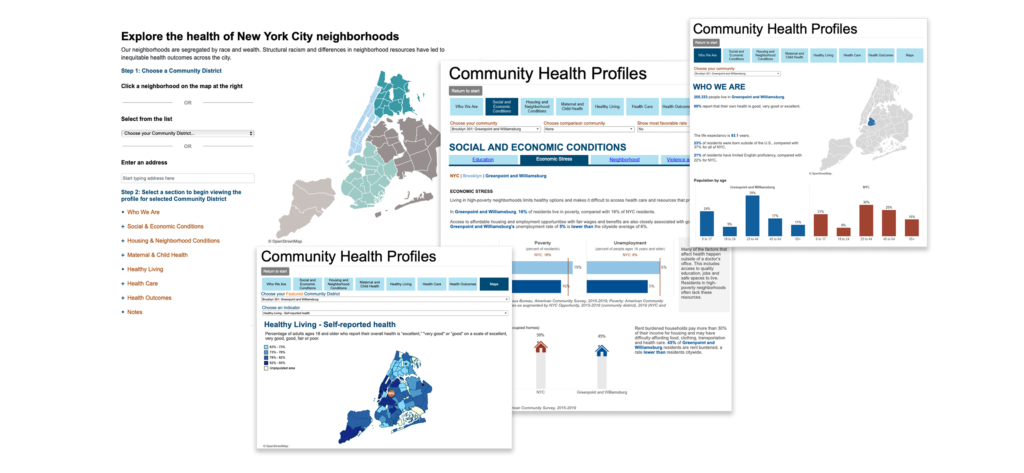
NYC Community Heath Profiles
HealthDataViz designed and developed interactive community health profiles to understand the health of NYC’s communities and encourage engagement and action.
Created in collaboration with NYC Dept. of Health & Mental Hygiene using Tableau and Javascript API
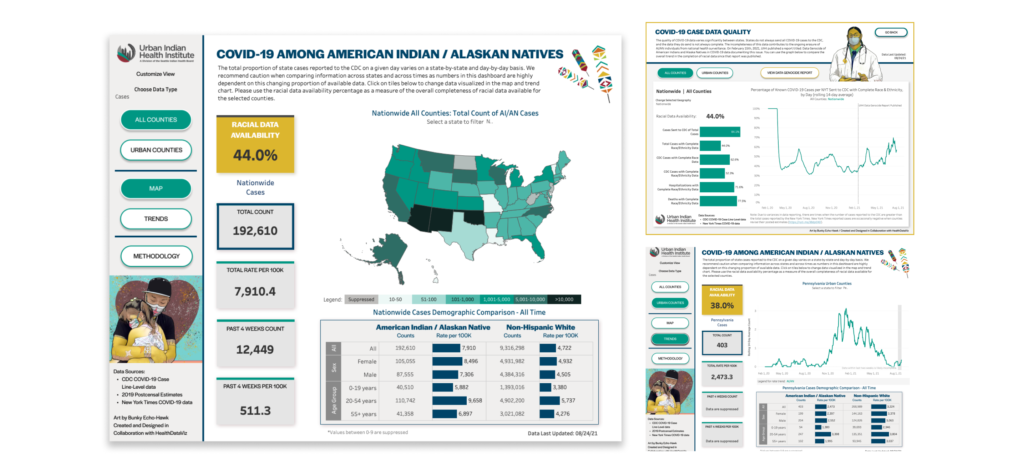
COVID-19 Among American Indian / Alaskan Native
The Urban Indian Health Institute engaged HDV to create this interactive dashboard to communicate CDC COVID-19 rates and outcomes for American Indians and Alaskan Natives compared to Non-Hispanic Whites.
Created in collaboration with Urban Indian Health Institute (UIHI) using Tableau and Figma

COVID-19 U.S. Vaccination Infographic
HealthDataViz collaborated with Jon Schwabish and a team at The Urban Institute to create a infographic which updated daily utilizing the CDC’s API along with ACS socioeconomic data.
Created in collaboration with The Urban Institute using Tableau and Figma
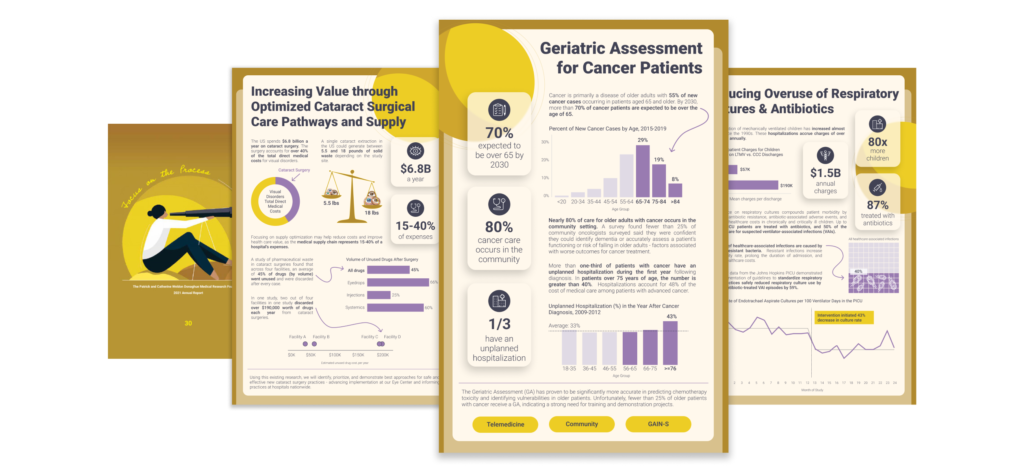
Donaghue Foundation Annual Report
A series of infographics developed for the print version of the 2021 annual report showcasing data that helped define the research projects of grant awardees.
Created in collaboration with The Donaghue Foundation using Figma
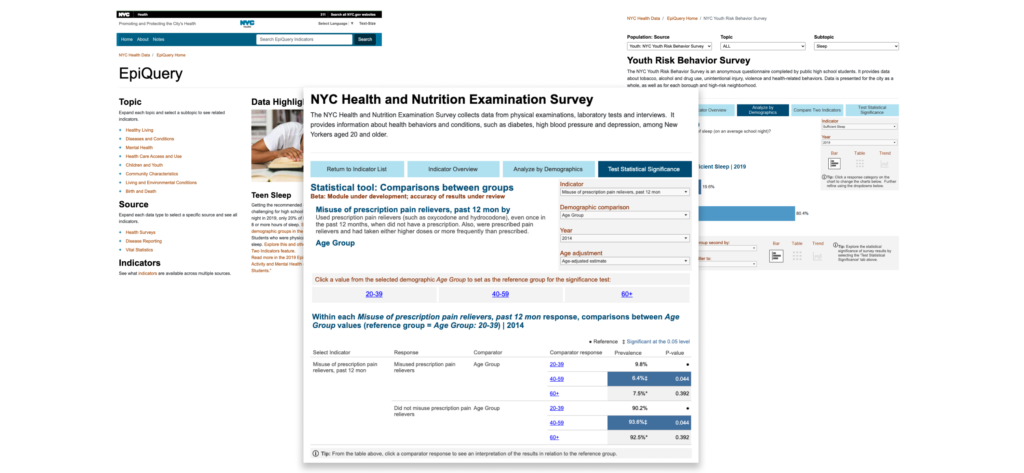
NYC Dept. of Health and Mental Hygiene Epiquery
The HDV team redesigned NYC’s DoHMH publicly available data exploration and analysis tool, Epiquery, to be accessible and usable by novices and experts alike.
Created in collaboration with NYC Dept. of Health & Mental Hygiene using Tableau and Javascript API
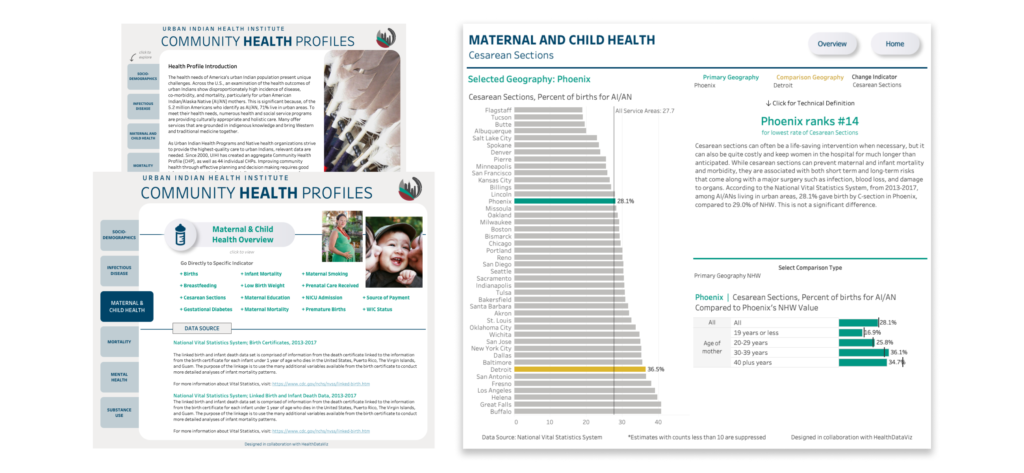
Community Health Profiles
HDV reimagined and redesigned the UIHI Community Health Profiles to be culturally sensitive and ensure that the unique health needs of America’s urban indian populations are clear and actionable.
Created in collaboration with Urban Indian Health Institute (UIHI) using Tableau

Staffing Plans and Performance Metrics
HealthDataViz reimagined a hospital association’s public patient care data to help patients and their families become better-educated and more proactive healthcare consumers using mock data in Tableau.

Hospital CEO Dashboard
HealthDataViz created this prototype of a hospital CEO performance monitoring dashboard originally created for data visualization expert Stephen Few’s Dashboard Design book using mock data.
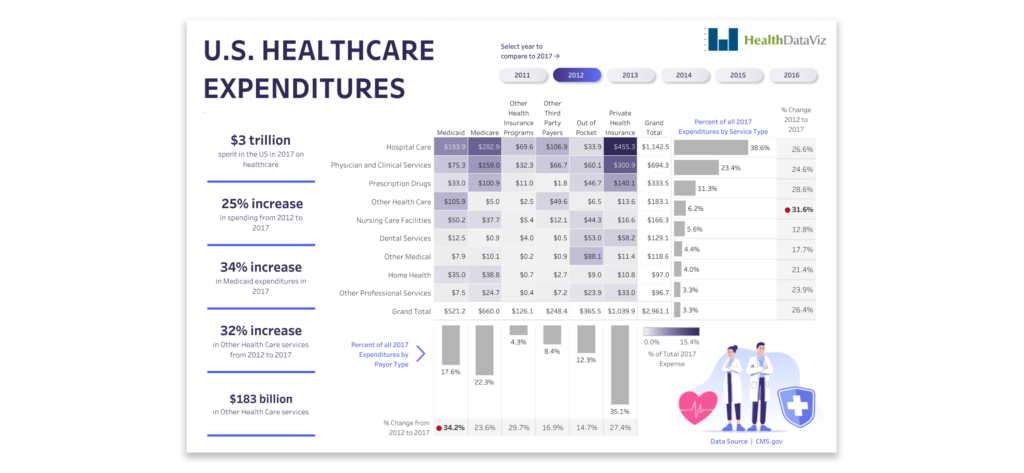
U.S. Healthcare Expenditures by Type and Payor
Using data from CMS.gov, HealthDataViz created an interactive display of U.S. healthcare expenditures by service type and payer, and how they have changed over time.