A Gantt chart for repeated tasks consists of a bar chart series showing the duration of a task, stacked on a transparent bar that pushes the visible bar out to the start of the task. My technique added two more series for each repeated task, one for the gap between repeats, the other for the duration of the repeat.
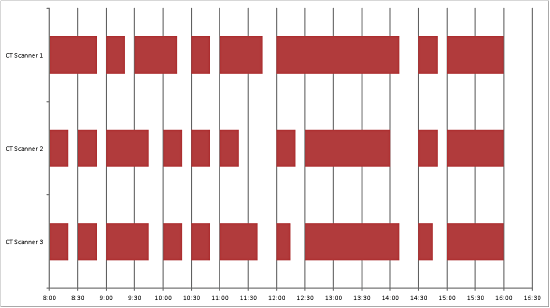
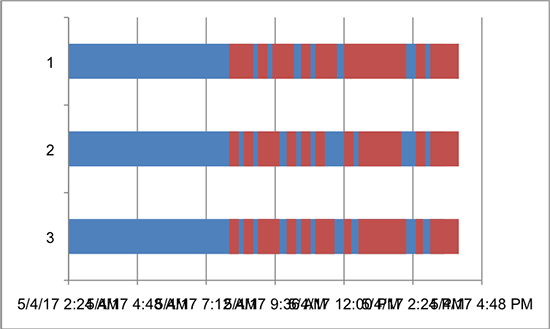
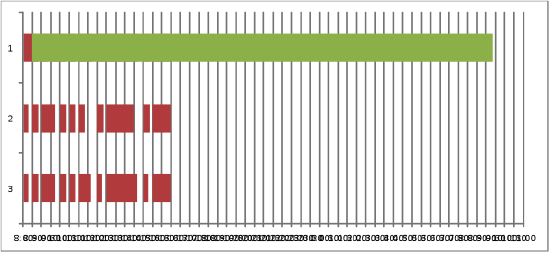
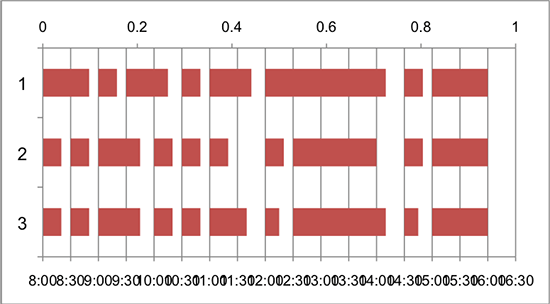
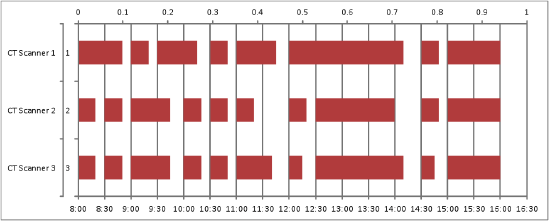
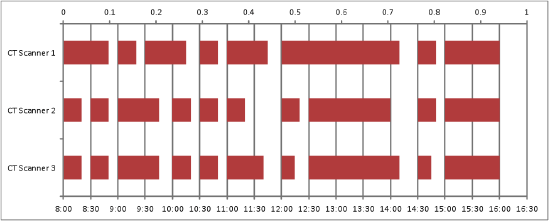
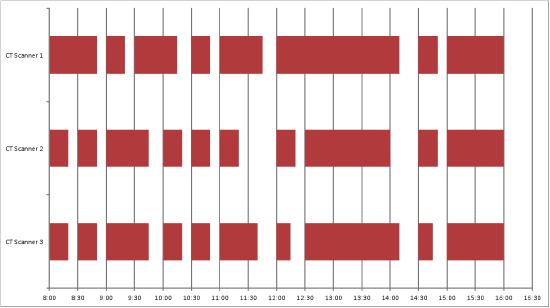
The attached excel workbook shows a Gantt chart set up to depict the utilization for three CT Scanners. The horizontal axis represents time and each bar represents appointment times.
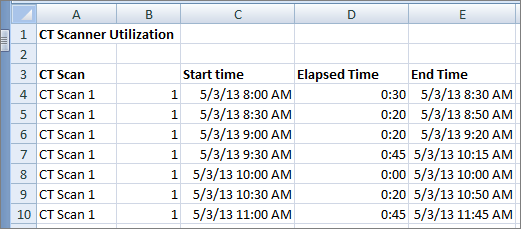
Step 1. Create the stacked bar chart. Highlight the range b3:d51 click on “Insert” tab. Select “Bar Chart” then select 2D “Stacked Bar” chart. Column B is the number used for the X values of the chart.
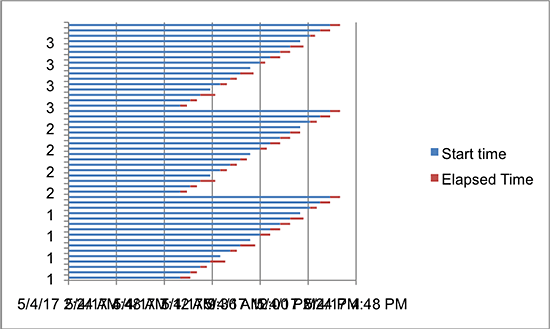
Step 2. Delete the legend.
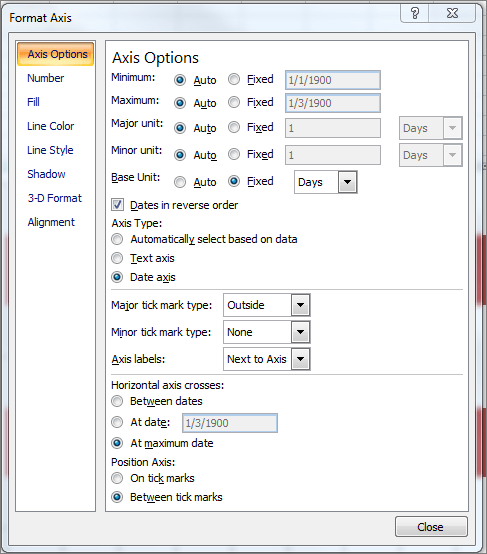
Step 3. Plot all items with the same x value in the same bar. Right click on vertical axis and select “Format Axis”. Select “Axis Options” click on “Date axis”. Click on “Dates in reverse order”. Under “Horizontal Axis Crosses” select “At maximum date” to display dates at the bottom.
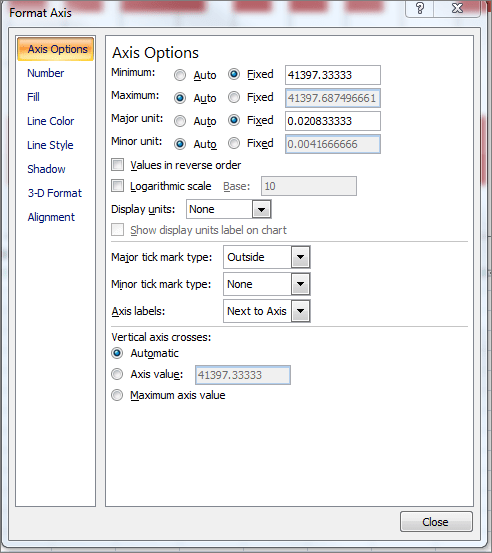
Step 4. Display time increments on the y axis. Right click on horizontal axis and select “Format Axis”. Select the “Axis Options” tab and adjust the Minimum settings to accommodate the dates you want to display. For this step you must enter the values as date serial numbers, not actual dates. In order to determine the serial number type the date into a cell in Excel and format the cell using “General” number format. See Excel workbook cell C52 for the “Minimum value”, and D52 for 30-minute time interval.
Select “Fixed” under minimum and type the number 41397.33333 in the cell. Select “Fixed” under major unit and type the number .020833333 in the cell to display 30-minute time interval.
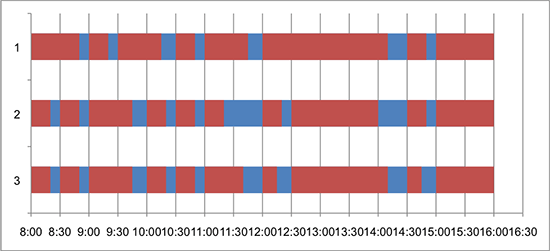
Right click horizontal axis and select “Format axis”. Select Number on the left hand side of pop up box and select “Time” and 13:30 format.
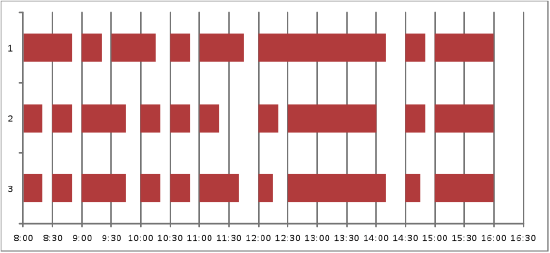
Step 5. Hide start time series data. Click on the chart and click on the first blue box in the first series to highlight the start time data series and right click select “Format Data Series”. Click on “Fill” tab on the left hand side of the box and select “No Fill”. Select “Border Color” and select “No line”.
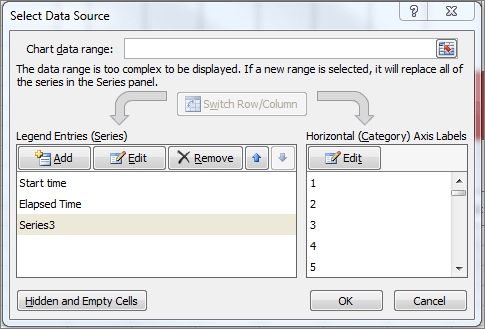
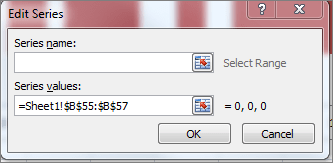
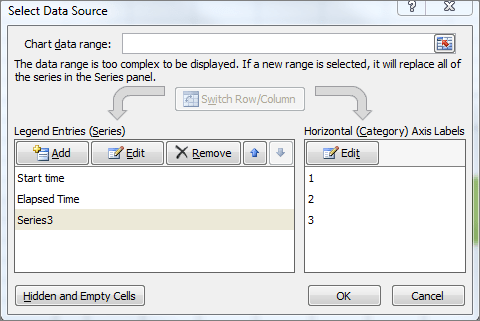
Step 6: Add informative vertical axis labels. Click on the chart, click “Design Tab” and click on “Select Data”. Under “Legend Entries”, click on “Add”. In the “Series Values” box highlight cells A55:B57 and click “OK”.
Step 7. Right click on green bar and select “Format Data Series” and under ‘Series Options” select secondary axis. Click on “Close”.
Step 8. Change the values in cells B55 through B57 from 1 to 0.
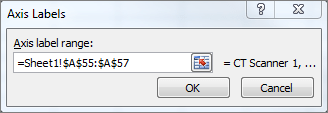
Step 9. Click on “Design Tab” and select “Select Data”. Under “Legend Entries”, click on “Series 3”. Under “Horizontal Categories” click on “Edit”. Highlight cells A55:A57. Click “OK”. Click “OK”.
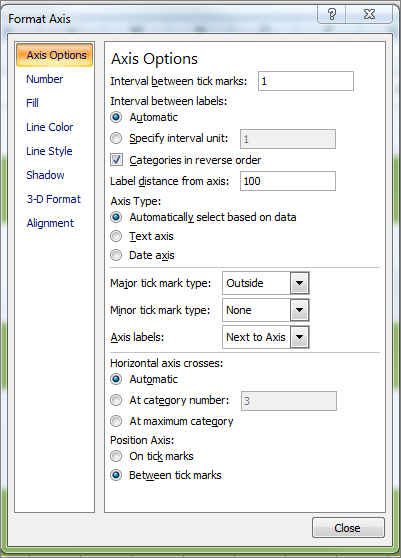
Step 10. Click on ‘Layout Tab” and click “Axis”. Select “Secondary Vertical Axis” and select “More Secondary Vertical Axis Options”. Click “Categories in Reverse Option” and Click on “Automatic” under “Horizontal axis crosses”.
Step 11. Delete the primary axis labels. Right click on primary vertical axis (1, 2 and 3) and press DEL key.
Step 12. Delete Secondary Horizontal axis labels. Right click on secondary horizontal axis on the top of the chart and press the DEL key.
Learn more about Gantt Charts in my May 17, 2013 newsletter “Visualize a New Approach“.


0 Comments