Today a client asked me to add an “average of averages” figure to some of his performance reports. I freely admit that a nervous and audible groan escaped my lips as I felt myself at risk of tumbling helplessly into the fifth dimension of “Simpson’s Paradox”– that is, the somewhat confusing statement that averaging the averages of different populations produces the average of the combined population. (I encourage you to hang in and keep reading, because ignoring this concept is an all too common and serious hazard of reporting data, and you absolutely need to understand and steer clear of it!)
Imagine that we’re analyzing data for several different physicians in a group. We establish a relation or correlation for each doctor to some outcome of interest (patient mortality, morbidity, client satisfaction). Simpson’s Paradox states that when we combine all of the doctors and their results, and look at the data in aggregate form, we may discover that the relation established by our previous research has reversed itself. Sometimes this results from some lurking variable(s) that we haven’t considered. Sometimes, it may be due simply to the numerical values of the data.
First, the “lurking variable” scenario. Imagine we are analyzing the following data for two surgeons:
- Surgeon A operated on 100 patients; 95 survived (95% survival rate).
- Surgeon B operated on 80 patients; 72 survived (90% survival rate).
At first glance, it would appear that Surgeon A has a better survival rate — but do these figures really provide an accurate representation of each doctor’s performance?
Deeper analysis reveals the following: of the 100 procedures performed by Surgeon A,
- 50 were classified as high-risk; 47 of those patients survived (94% survival rate)
- 50 procedures were classified as routine; 48 patients survived (96% survival rate)
Of the 80 procedures performed by Surgeon B,
- 40 were classified as high-risk; 32 patients survived (80% survival rate)
- 40 procedures were classified as routine; 40 patients survived (100% survival rate)
When we include the lurking classification variable (high-risk versus routine surgeries), the results are remarkably transformed.
Now we can see that Surgeon A has a much higher survival rate in the high-risk category (94% v. 80%), while Surgeon B has a better survival rate in the routine category (100% v. 96%).
Let’s consider the second scenario, where numerical values can change results.
First, imagine that every month, the results of a patient satisfaction survey are exactly the same (Table 1).
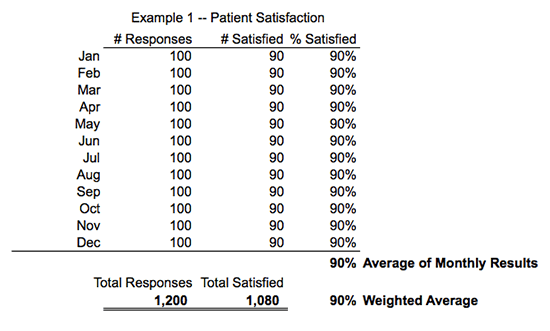
The Table shows that calculating an average of each month’s result produces the same result (90%) as calculating a Weighted Average (90%). This congruence exists because each month, the denominator and numerator are exactly the same, contributing equally to the results.
Now consider Table 2, which also displays the number of responses received from a monthly patient-satisfaction survey, but where the number of responses and the number of patients who report being satisfied differ from month to month. In this case, taking an average of each month’s percentage allows some months to contribute to or affect the final result more than others. Here, for example, we are led to believe that 70% of patients are satisfied.
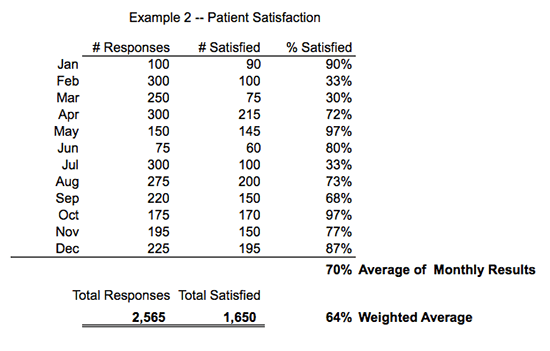
All results should in fact be treated as the data-set of interest, where the denominator is Total Responses (2,565) and the numerator is Total Satisfied (1,650). This approach correctly accounts for the fact that there is a different number of values each month, weights them equally, and produces a correct satisfaction rate of 64%. That is quite a difference from our previous answer of 6% — almost 145 patients!
How we calculate averages really does matter if we are committed to understanding our data and reporting it correctly. It matters if we want to identify opportunities to improve, and are committed to taking action.
As a final thought about averages, here is a wryly amusing bit of wisdom on the topic that also has the virtue of being concise. “No matter how long he lives, a man never becomes as wise as the average woman of 48.” -H. L. Mencken.
I’d say that about sums up lurking variables and weighted averages — wouldn’t you?


1 Comment
Meic Goodyear · May 13, 2014 at 3:00 pm
A post that should be part of any manager’s training.
Meanwhile, pace H.L. Mencken, I wish I knew how to identify an “average woman of 48”, never mind how to calculate her wisdom!